Download
1 / 9
90 likes | 190 Views
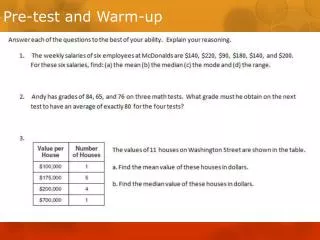
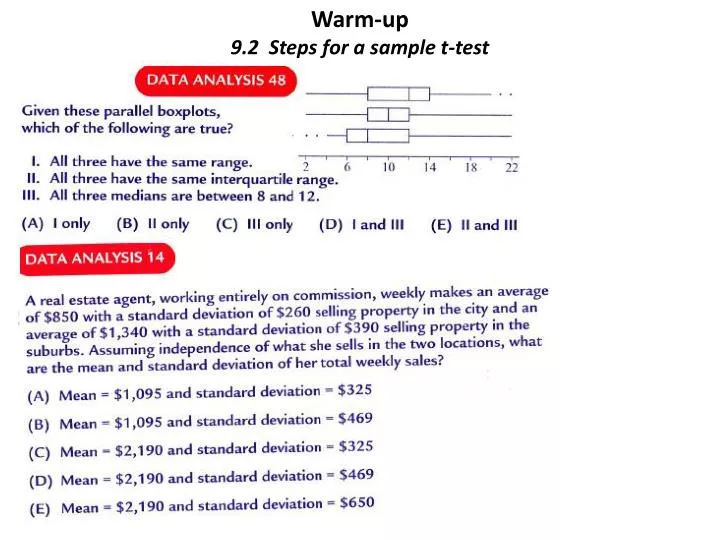
Warm-up 9.2 Steps for a sample t-test. Answers to P6 and P7. Answers to h.w. continued…. Triphammer Road Continued…. Residents along Triphammer Road are displeased. The mean mph is greater than the speed limit (30 mph). To get the police involved, they’ll need to show the true mean of the

E N D
Triphammer Road Continued… Residents along Triphammer Road are displeased. The mean mph is greater than the speed limit (30 mph). To get the police involved, they’ll need to show the true mean of the speed is in fact greater than the posted mph. First, let’s calculate the test statistics. Test statistic for a proportion Test statistic for the mean
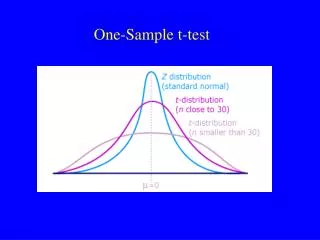
Calculating the P-value from the test statistic Ho: μ= 30 mph HA: μ > 30 mph Ho: μ = 30 mph HA: μ ≠ 30 mph P-value for the mean: is the probability of getting a random sample From a distribution with the mean given the null hypothesis. Based on the p-value we will reject or fail to reject the null hypothesis.
T-Test on the Calculator Fixed Level Testing is where the α is given. You reject the null Hypothesis in favor of the alternate hypothesis if your P-value is less than the level of significance.
Components of a Significance Test for a Mean pg 589 Problem: The thermostat in your classroom is set to 72o F, but you think the thermostat isn’t working well. On seven randomly selected days you measure the temperature at your seat. Your measurements are 71, 73, 69, 68, 69, 70 and 71. Complete a significance test to determine if the temperature is different from the 72o F set on the thermostat. Step 1: Name the test and check the conditions. Step 2: State the hypotheses. (with symbols and words)
Last Steps Step 3: Compute the statistics, P-value, and draw a sketch. Since the data is given enter the 7 temperatures under L1. Then STAT -> -> TEST , Choose T-Test with Input as Data. Step 4: Write your conclusion, summarize your findings in step 3 to support your conclusion. Use the level of significance if given to reject or fail to reject the null hypothesis. H.W. Read 9.2 Copy formulas, and terms. Complete E #17 When checking the conditions draw a graph to demonstrate the sample is approximately normal. *Bring your textbook as well. (This is part of the h.w. grade)
8.1, 8.2, 9.1 and 9.2 Notebook Check Ch.8 level of confidence(capture rate), margin of error significance test for a proportion, statistical significance, null hypothesis, alternate hypothesis, test statistic, p-value, critical values, level of significance, type 1 error, type 2 error, power of a test, one-sided, two-sided test Ch.9 Degrees of freedom, Sampling distribution for s, t-table, t-test, t-distribution, significance test for the mean. (17 terms –Ch. 8, 6 terms –Ch 9 = 23 terms at 1pt each = 23pts) Notes: 8.1, 8.1 (Day 2), 8.2, 8.2 (Day 2), 8.2 (Errors), 9.1, 9.2 ( 7 notes w/ Warm-ups 11 pts each = 77 pts) (3 pt warm-up 8 pts notes = 11 pts) 77 pts + 23 pts = 100 for Ntbk