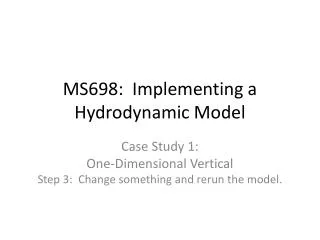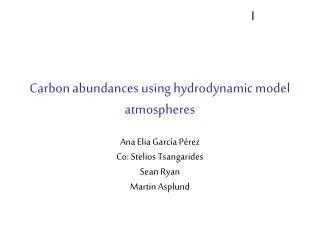
Update on hydrodynamic model comparisons
Update on hydrodynamic model comparisons. Marjy Friedrichs and Carl Friedrichs Aaron Bever (post-doc) Leslie Bland (summer undergraduate student). Methods: Target diagrams ( Jolliff et al., 2009). Total RMSD 2 = Bias 2 + unbiased RMSD 2. mean. s easonal variability. Bias.

Update on hydrodynamic model comparisons
E N D
Presentation Transcript
Update on hydrodynamic model comparisons Marjy Friedrichs and Carl Friedrichs Aaron Bever (post-doc) Leslie Bland (summer undergraduate student)
Methods: Target diagrams (Jolliff et al., 2009) Total RMSD2= Bias2+ unbiased RMSD2 mean seasonal variability Bias y> 0: overestimates mean 1 Unbiased RMSD 1 -1 x > 0 overestimates variability -1
Methods: Target diagrams (Jolliff et al., 2009) Total RMSD2= Bias2+ unbiased RMSD2 mean variability Bias y> 0: overestimates mean 1 Unbiased RMSD 1 -1 x > 0 overestimates variability -1
Methods: Target diagrams (Jolliff et al., 2009) Normalization by standard deviation of observations Bias/stdev(obs) y> 0: overestimates mean 1 outer circle: Model-data misfit = variability in data Unbiased RMSD/stdev(obs) 1 -1 x > 0 overestimates variability -1
Methods: Target diagrams (Jolliff et al., 2009) Normalization by standard deviation of observations Bias/stdev(obs) y> 0: overestimates mean 1 outer circle: Model-data misfit = variability in data Unbiased RMSD/stdev(obs) 1 -1 x > 0 overestimates variability -1
Methods: Target diagrams (Jolliff et al., 2009) Normalization by standard deviation of observations Bias/stdev(obs) y> 0: overestimates mean 1 outer circle: Model-data misfit = variability in data Unbiased RMSD/stdev(obs) 1 -1 model does worse than the mean of the data x > 0 overestimates variability -1
Model simulations • Original simulations (summer ‘10) • CH3D (P. Wang) • EFDC (J. Shen) • ChesROMS (W. Long) • CBOFS2 (L. Lanerolle) • New ‘consistent forcing’ simulations (this week!) • EFDC (J. Shen) • CBOFS2 (L. Lanerolle) • UMCES ROMS (Y. Li)
Preliminary model comparisons (Summer ‘10) • Initially examined salinity at the halocline (max dS/dz) as a function of bathymetric error, latitude, salinity, oxygen, bottom depth Conclusion: For all four models, model skill (total RMSD) is primarily a function of mean salinity and/or latitude
New model comparisons (Fall ‘10) • Best match over ±12 hour time window • Additional variables: dS/dzat max dS/dz z of max dS/dz S at max dS/dz • New ‘consistent forcing’ simulations
New model comparisons (Fall ‘10) • Best match over ±12 hour time window • Additional variables: dS/dzat max dS/dz z of max dS/dz S at max dS/dz • New ‘consistent forcing’ simulations
Surface Salinity = inst match = best match (over 24h)
New model comparisons (Fall ‘10) • Best match over ±12 hour time window • Additional variables: dS/dzat max dS/dz z of max dS/dz S at max dS/dz • New ‘consistent forcing’ simulations
Salinity (psu) Stratification= max dS/dz
Salinity (psu) depth of max dS/dz
Salinity (psu) Salinity at max dS/dz
New model comparisons (Fall ‘10) • Best match over ±12 hour time window • Additional variables: dS/dzat max dS/dz z of max dS/dz S at max dS/dz • New ‘consistent forcing’ simulations
Surface Salinity Red = First runs Black = New or consistent forcing runs. The EFDC results here are without showing the far outliers. CBOFS2 EFDC = old results = new results New forcing: Slight improvement in CBOFS2 results Slight degradation in EFDC results
max dS/dz old forcing Salinity (psu) new forcing
Salinity (psu) max dS/dz new forcing Salinity (psu)
depth of max dS/dz old forcing Salinity (psu) Salinity (psu) new forcing
Salinity (psu) depth of max dS/dz new forcing Salinity (psu)
Salinity at max dS/dz old forcing Salinity (psu) Salinity (psu) new forcing
Salinity (psu) Salinity at max dS/dz new forcing Salinity (psu)
Next steps for hydrodynamic comparisons? • Why does CH3D produce superior stratification? • Vertical grid structure? C&D canal? Bathymetry? • other? • Next model runs • Atmospheric forcing? • Boundary conditions on shelf? • Additional metrics