Download
1 / 37
370 likes | 561 Views
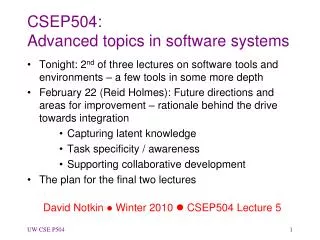
Today’s topics General discussion on systems biology Metabolomics approach for determining growth-specific metabolites based on FT-ICR-MS Self organizing mapping(SOM). What is systems biology? Each lab/group has its own definition of systems biology.

E N D
Today’s topics • General discussion on systems biology • Metabolomics approach for determining growth-specific metabolites based on FT-ICR-MS • Self organizing mapping(SOM)
What is systems biology? Each lab/group has its own definition of systems biology. This is because systems biology requires the understanding and integration of different branches of science and different levels of OMICS information together and individual labs/groups are working on different area. Theoretical target: Understanding life as a system. Practical Targets: Serving humanity by developing new generation medical tests, drugs, foods, fuel, materials, sensors, logic gates……
Integration of omics to define elements (genome, mRNAs, Proteins, metabolites) Understanding organism as a system (Systems Biology) Understanding species-species relations (Survival Strategy) Bioinofomatics Genome: 5’ 3’ b c h i k m 3’ 5’ a d e f g j l Transcriptome: Activation (+) A 5’ 3’ b c h i k m 3’ 5’ G a d e f g j l Repression (-) G Proteome, Interactome Protein A B C D E F G H I J K L M Function Unit A B C D E G H K I L M J F Metabolome FT-MS comprehensive and global analysis of diverse metabolites produced in cells and organisms B C I L Metabolite 1 Metabolite 2 Metabolite 3 Metabolite 5 D E F Metabolic Pathway H K Metabolite 4 Metabolite 6
Modelling can be extended to Plant-Human interaction. Traditional & Modern Knowledge of Medicinal Plants Human Omics Plant Omics Proteome Interactome Transcriptome Proteome Interactome Transcriptome Therapeutic Usage Physiological Activity Prescription Medicinal Herb. Metabolomics Metabolomics ・・・ ・・・ ・・・ ・・・ ・・・ ・・・ ・・・ ・・・ Connect with Physiological Activity Connect with Therapeutic Usage Plant Systems Biology Human Systems Biology Plant-Human interacted Systems biology Okada, T., Afendi, FM., Amin, M., Takahashi, H., Nakamura, K., Kanaya, S., Current Computer Aided Drug Design, 179-196, 10, (2010)
Modelling can be extended to Plant-Human interaction. Traditional & Modern Knowledge of Medicinal Plants Human Omics Plant Omics Proteome Interactome Transcriptome Proteome Interactome Transcriptome Therapeutic Usage Physiological Activity Prescription Medicinal Herb. Metabolomics Metabolomics ・・・ ・・・ ・・・ ・・・ ・・・ ・・・ ・・・ ・・・ Connect with Physiological Activity Connect with Therapeutic Usage Plant Systems Biology Human Systems Biology Plant-Human interacted Systems biology (1) Comprehensively understanding of each layers Principal component analysis BL-SOM DPClus ………. ……….
Modelling can be extended to Plant-Human interaction. Traditional & Modern Knowledge of Medicinal Plants Human Omics Plant Omics Proteome Interactome Transcriptome Proteome Interactome Transcriptome Therapeutic Usage Physiological Activity Prescription Medicinal Herb. Metabolomics Metabolomics ・・・ ・・・ ・・・ ・・・ ・・・ ・・・ ・・・ ・・・ Connect with Physiological Activity Connect with Therapeutic Usage Therapeutic Usage Physiological activity etc. Herb composition metabolites in herbs. (2) Relation between layers Mathematical modeling Partial Least Square Multi-regression Analysis Discriminant analysis
Plant-Human interaction Traditional & Modern Knowledge of Medicinal Plants Human Omics Plant Omics Proteome Interactome Transcriptome Proteome Interactome Transcriptome Therapeutic Usage Physiological Activity Prescription Medicinal Herb. Metabolomics Metabolomics ・・・ ・・・ ・・・ ・・・ ・・・ ・・・ ・・・ ・・・ Connect with Physiological Activity Connect with Therapeutic Usage Plant Systems Biology Human Systems Biology Plant-Human interacted Systems biology (1,2)Multivariate analysis Partial least Square modeling Principal Compornet Analysis BL-Selforganizing Map DPClus (Network clustering) …. …. Metabolomics Transcriptomcs
This situation can be extenededto Plant-Human interaction. Traditional & Modern Knowledge of Medicinal Plants Human Omics Plant Omics Proteome Interactome Transcriptome Proteome Interactome Transcriptome Therapeutic Usage Physiological Activity Prescription Medicinal Herb. Metabolomics Metabolomics ・・・ ・・・ ・・・ ・・・ ・・・ ・・・ ・・・ ・・・ Connect with Physiological Activity Connect with Therapeutic Usage (3) Knowledge Systematization of interaction between human and plants Database
Plant-Human interaction Traditional & Modern Knowledge of Medicinal Plants Human Omics Plant Omics Proteome Interactome Transcriptome Proteome Interactome Transcriptome Therapeutic Usage Physiological Activity Prescription Medicinal Herb. Metabolomics Metabolomics ・・・ ・・・ ・・・ ・・・ ・・・ ・・・ ・・・ ・・・ Connect with Physiological Activity Connect with Therapeutic Usage
(4) Systems Biology for Plant-Human interaction Traditional & Modern Knowledge of Medicinal Plants Human Omics Plant Omics Proteome Interactome Transcriptome Proteome Interactome Transcriptome Therapeutic Usage Physiological Activity Prescription Medicinal Herb. Metabolomics Metabolomics ・・・ ・・・ ・・・ ・・・ ・・・ ・・・ ・・・ ・・・ Connect with Physiological Activity Connect with Therapeutic Usage Plant Systems Biology Human Systems Biology Plant-Human interacted Systems biology [1] Responsibility of synergetic activity [2] reduction of side effects in medication for the complexity of disease derived by mutifactorial causes [3] metabolites in plants interact with multiple targeted proteins in human regulate gene expression lead to dynamical state change in metabolome and physiological activity in human.
Metabolomics approach for determining growth-specific metabolites based on FT-ICR-MS
[1] Metabolomics Tissue Samples MS Species Metabolite information Molecular weight and formula Fragmentation Pattern Experimental Information Species Species-Metabolite relation DB Metabolites B C I L Metabolite 1 Metabolite 2 Metabolite 3 Metabolite 5 D E F H K Metabolite 4 Metabolite 6 Interpretation of Metabolome
10 T8 T6 T7 T5 T4 T3 T2 1 OD600 T1 0.1 0 200 400 600 800 Time (min) M M+1 M/2 Data Processing from FT-MS data acquisition of a time series experiment to assessment of cellular conditions • Metabolite quantities • for time series experiments E. coli (b) Data preprocessing and constructing data matrix (c) Classification of ions into metabolite-derivative group Time point (d) Annotation of ions as metabolites m/z Metabolites (e) Assessment of cellular condition by metabolite composition
(b) Data matrix metab.1 metab.200 time 1 time 2 719.4869 747.5112 time 8 722.505 time Software are provided by T. Nishioka (Kyoto Univ./Keio Univ.)
M-12 (c) Classification of ions into metabolite-derivative group (DPClus) Correlation network for individual ions. Intensity ratio between Monoisotope (M) and Isotope (M+1) # of Carbons in molecular formula: M-8 5 M-11 4 3 M-9 M-5 M-10 6 M-14 M-4 9 M-7 M-6 2-3 M-13 8 M-15 7 10 2-2 M-16 11 PG10 M-17 1-3 PG9 PG3 M-3 M-2 PG4 1-4,5 1-1 M-1 PG7 PG6 PG1 PG2 2-1 PG8 PG5 1-6 1-2
10 T8 T6 T7 T5 T4 T3 OD600 T2 1 T1 0.1 0 200 400 600 800 Time (min) M=220 X N=8 (e) Estimation of cell condition based on a function of the composition of metabolites. PLS (Partial Least Square regression model) -- extract important combinations of metabolites. N (biol.condition) << M (metabolites) Metabolites Responses K=1 measurement points PLS Y N=8 cell condition cell condition Y(Cell density)= a1 x1 +…+ aj xj +….+ aM xM xj, the quantity for jth metabolites
(e) Assessment of cellular condition by metabolite compositionDetection of stage-specific metabolites(PLS model of OD600 to metabolite intensities) y(OD600 Cell Density)= a1 x1 +…+ aj xj +….+ aM xM xj , the quantity for jth aj> 0, stationary phase-dominant metabolites aj < 0, exponential phase-dominant metabolites MS/MS analyses PG2,4,6,8,10 0.1 omega-Cycloheptylnonanoate dTDP-6-deoxy-L-mannose Parasperone A omega-Cycloheptylundecanoate, cis-11-Octadecanoic acid UDP-glucose, UDP-galactose UDP aj Octanoic acid UDP-N-acetyl-D-glucosamine UDP-N-acetyl-D-mannosamine dTMP, dGMP, 3'-AMP NADH Lenthionine 80 metabolites 0.0 120 metabolites Argyrin G omega-Cycloheptyl-alpha-hydroxyundecanoate ATP, dGTP omega-Cycloheptyl-alpha-hydroxyundecanoate dTDP Glyoxylate PG1,3,5,7,9 MS/MS analyses ADP, Adenosine 3',5'-bisphosphate, dGDP ADP-(D,L)-glycero-D-manno-heptose Red: E.coli metabolites;Black: Other bacterial metabolites NAD -0.15 Exponential-phase dominant Stationary-phase dominant
10 Phosphatidylglycerols detected by MS/MS spectra unsaturated PGs cyclopropanated PGs (b) Relation of mass differences among PG1 to 10marker molecules (Cluster 1) Exponential phase PG5 30:1(14:0,16:1) PG1 32:1(16:0,16:1) PG3 34:1(16:0,18:1) ∆(CH2)2 ∆(CH2)2 28.0281 28.0315 2.0138 US Cyclopropane Formaiton of PGs CFA 14.0170 CFA 14.0187 CFA 14.0110 PG7 34:2(16:1,18:1) PG9 36:2(18:1,18:1) ∆(CH2)2 28.0330 Stationary phase PG6 31:0(14:0,c17:0) PG2 33:0(16:0,c17:0) PG4 34:5(16:0,c19:0) ∆(CH2)2 ∆(CH2)2 CFA 14.0181 CFA 14.0197 28.0298 28.0237 2.0051 US PG8 35:1(16:1,c19:1) PG10 37:1(18:1,c19:0) ∆(CH2)2 (Cluster 2) 28.0314 • Cyclopropane Formation of PGs occurs in the transition from exponential to stationary phase.
Time-series Data Growth curve 10 j … T … 1 2 1 0.1 0.01 Time Expression profiles Stage 1 2 …. j … T T, # of time-series microarray experiments D, # of genes in a microarray When we measure time-series microarray, gene expression profile is represented by a matrix SOM makes it possible to examine gene similarity and stage similarity simultaneously.
Time-series Data Growth curve 10 j … T … 1 2 1 0.1 0.01 Time Expression profiles Expression similarity Stage 1 2 …. j … T T, # of time-series microarray experiments D, # of genes in a microarray … … Stage similarity Multivariate Analysis SOM : expression similarity of genes andstage similaritysimultaneously. STATES State-Transition BL-SOM is available at http://kanaya.aist-nara.ac.jp/SOM/ When we measure time-series microarray, gene expression profile is represented by a matrix SOM makes it possible to examine gene similarity and stage similarity simultaneously.
SOM was developed by Prof. Teuvo Kohonen in the early 1980s Multi-dimensional data/input vectors are mapped onto a two dimensional array of nodes In original SOM, output depends on input order of the vectors. To remove this problem Prof. Kanaya developed BL-SOM. [1] Initial model vectors are determined based on PCA of the data. [2] The learning process of BL-SOM makes the output independent of the order of the input vectors.
SOM Algorithm Source: “Clustering Challenges in Biological Networks” edited by S. Butenko et. al.
SOM Algorithm Source: “Clustering Challenges in Biological Networks” edited by S. Butenko et. al.
SOM Algorithm Source: “Clustering Challenges in Biological Networks” edited by S. Butenko et. al.
SOM Algorithm in Fig. before Source: “Clustering Challenges in Biological Networks” edited by S. Butenko et. al.
[1] Detection method for transition points in gene expression and metabolite quantity based on batch-learning Self-organinzing map (BL-SOM) [2] Diversity of metabolites in species Species-metabolite relation Database Self-organizing Mapping (Summary) X1 XT Gene i (xi1,xi2,..,xiT) X2 T, different time-series microarray experiments
Self-organizing Mapping (Summary) Arrangement of lattice points in multi-dimensional expression space Lattice points are optimized for reflecting data distribution X1 Gene Classification Genes are classified into the nearest lattice points XT Gene i (xi1,xi2,..,xiT) X2
Self-organizing Mapping (Summary) Arrangement of lattice points in multi-dimensional expression space Lattice points are optimized for reflecting data distribution X1 Gene Classification Genes with similar expression profiles are clusterized to identical or near lattice points X1 (Time 1) Feature Mapping In the i-th condition, lattice points containing only highly (low) expressed genes are colored by red (blue). XT X2 (Time 2) X2 (ex.) Xk> Th.(k) Xk< -Th.(k) X3 (Time 3) k=1,2,…,T Visually comparing among each stage of time-series data ….. ….. ….. XT (Time T) Non-linear projection of multi-dimensional expression profiles of genes. Original dimension is conserved in individual lattice points. Several types of information is stored in SOM
Estimation of transition points; Bacillus subtilis (LB medium) (Data: Kazuo Kobayashi, Naotake Ogasawara (NAIST)) Stage 1 2 3 4 5 6 7 8 High prob. 10 0 Cell Density (OD600 ) 6 7 5 8 4 1 log(Prob. Density) 3 2 0.1 -1000 1 0.01 LB 0.001 -2000 0 200 400 600 800 1000 Low prob. (min) SOM for time-series expression profile State transition point is observed between stages 3 and 4
Integerated analysis of gene expression profile and metabolite quantity data of Arabidopsis thaliana (sulfur def./cont.; Data are provided by K.Saito, M. Hirai group (PSC) ) ppm(error rate) Nakamura et al (2004)
State transition Feature Maps Leaf Leaf Gene Metabolites (m/z) Lattice points with highly difference between 12 and 24 h. Blue: Decreased Red: increased Root Root Accurate molecular weights Candidate metabolites corresponding to accurate molecular weights 3. Species-metabolite relation Database
Download sites of BL-SOMRiken: http://prime.psc.riken.jp/NAIST: http://kanaya.naist.jp/SOM/ Application of BL-SOM to “-omics” Genome Kanaya et al., Gene, 276, 89-99 (2001) Abe et al., Genome Res., 13, 693-702, (2003) Abe et al., J.Earth Simulator, 6, 17-23, (2003) Abe et al., DNA Res., 12, 281-290. (2005) Transcriptome Haesgawa et al., Plant Methods, 2:5:1-18 (2006) Metabolome Kim et al., J. Exp.Botany, 58, 415-424, (2007) Fukusaki et al., J.Biosci.Bioeng., 100, 347-354, (2005) Transcriptome and Metabolome Hirai, M. Y., M. Klein, et al. J.Biol. Chem., 280, 25590-5 (2005) Hirai, M. Y., M. Yano, et al. Proc Natl Acad Sci U S A 101, 10205-10 (2004) Morioka, R, et al., BMC Bioinformatics, 8, 343, (2007) Yano et al., J.Comput. Aided Chem.,7,125-136 (2007) … …
Some other popular clustering/classification algorithms: K-mean clustering Support vector machines
Summary of Bioinformatics Tool developed in our laboratoryhttp://kanaya.naist.jp/~skanaya/Web/JTop.html All softwares and DB are freely accessable via Web. Metabolomics -- MS data processing Transcriptome and Metabolomics Profiling -- estimation of transition points Species-metabolite DB Network analysis: PPI Transcriptomics -- Statistics, Profiling, …
Some websites www.geneontology.org www.genome.ad.jp/kegg www.ncbi.nlm.nih.gov www.ebi.ac.uk/databases http://www.ebi.ac.uk/uniprot/ http://www.yeastgenome.org/ http://mips.helmholtz-muenchen.de/proj/ppi/ http://www.ebi.ac.uk/trembl http://dip.doe-mbi.ucla.edu/dip/Main.cgi www.ensembl.org Some websites where we can find different types of data and links to other databases