Download
1 / 47
470 likes | 636 Views
Evaluation of Social Norms Marketing Campaigns: Five Sites across 8 Years. Adrienne Keller, Ph.D. National Social Norms Institute University of Virginia akeller@virginia.edu. Social Norms Interventions. What they do NOT do What they DO Why they work Characteristics

E N D
Evaluation of Social Norms Marketing Campaigns: Five Sites across 8 Years Adrienne Keller, Ph.D. National Social Norms Institute University of Virginia akeller@virginia.edu
Social Norms Interventions • What they do NOT do • What they DO • Why they work • Characteristics • Evidence of effectiveness • Limitations • Conclusions
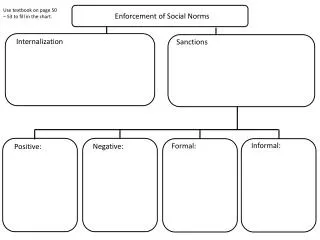
Social Norms Interventions What They Do NOT Do
Social Norms Interventions What They Do
Most (83%) Adults in Illinois Don’t Smoke* *Source: Centers for Disease Control, 2008 Tobacco Use in Illinois Adults
Why do social norms interventions change behavior? Think about “peer pressure” And how others’ choices influence our own…
Q.: How many alcoholic drinks do you think the typical student at your school had the last time they “partied” or socialized? Q.: How many alcoholic drinks did you have the last time you “partied” or socialized? Source: NCHA, Spring 2008, n= 80,121
AND… We don’t like contradictions.
a MINORITY of our youth Are addicted to tobacco Do use drugs Do have a serious problem with alcohol. MOST of our youth Don’t smoke cigarettes Don’t do drugs Don’t use alcohol or have an alcohol problem.
IDENTIFIED ISSUES ANTICIPATED OUTCOMES DESIRED IMPACT INTERVENTION GOAL Personal alcohol misuse Harm Reduction: Decrease alcohol-related morbidity & mortality Social norms marketing campaign Decrease Alcohol Use Correct perception of norm Misperceived norm INTERVENTION STRATEGY Misperceived norm
Characteristics of Social Norms Marketing
Positive • Inclusive • Empowering
Evidence of Effectiveness Good theory…great media… But does it work?
Participating Schools • Five universities • 4 public; 1 private • Thru-out USA • Between 14K to 46K students • Funding: Anhauser-Busch Fndtn • ACHA’s NCHA • 2002 through 2009: some years
Social Norms Campaigns • Each university developed its own campaign using the five step model
Five Step Model Choose the Audience Gather & Evaluate Data Develop & Test Message Implement Campaign Evaluate Effectiveness
YES for 1 and 2 • Schl 1: Race/Ethnicity only • % White • % Hispanic • Schl 2: Everything! • Age • % Female • % White • % in Res Hall • % Frat/Soro
YES for 3 and 4 • Schl 3: Residence only • % in Res Hall • Schl 4: Sex, Race, Residence • % Female • % White • % in Res Hall
and YES for 5 • Schl 5: Everything! • Age • % Female • % White • % in Res Hall • % Frat/Soro • So, we controlled for everything in our analyses.
Linear Mixed Effects Models • Did perceptions change across years? • Perception: ACHA-NCHA question • Controlled for demographics • Within each school • Did use change across years? • Use: ACHA-NCHA question • Controlled for demographics • Within each school • By perception
Duh…Beautiful Stats… But what do they mean?
Limitations • Internal Validity • Exposure not included in analysis • Other interventions not included • Related events not included • Moderate to low sample response rates • External Validity • Population characteristics • Environmental characteristics • Implementation fidelity
Conclusions Misperceptions in all 5 schools • Real world settings • Diverse schools • Actual drinks decreased in 4 of 5 • “Gap” decreased in 2 of 5 • Importance of longitudinal data • Single year results unclear • Effects & relationship only become clear over the years
Thank You Questions, Comments ???