Download
1 / 33
420 likes | 861 Views
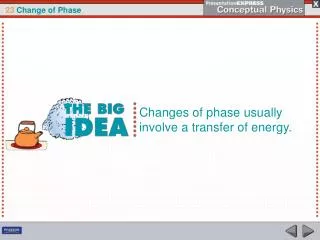
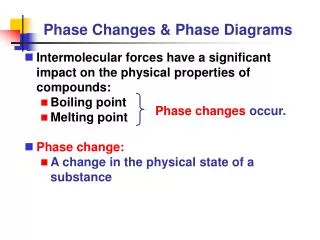
Phase Changes & Phase Diagrams. Intermolecular forces have a significant impact on the physical properties of compounds: Boiling point Melting point Phase change: A change in the physical state of a substance. Phase changes occur. Phase Changes & Phase Diagrams.

E N D
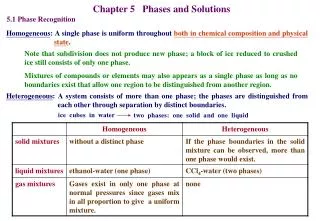
Phase Changes & Phase Diagrams • Intermolecular forces have a significant impact on the physical properties of compounds: • Boiling point • Melting point • Phase change: • A change in the physical state of a substance Phase changes occur.
Phase Changes & Phase Diagrams • You should know what phase change occurs for each of the following: • Melting • Freezing • Vaporization • Condensation • Sublimation • Deposition
Phase Changes & Phase Diagrams • Melting: • Solid Liquid • Freezing: • Liquid Solid • Vaporization • Liquid Gas • Condensation • Gas Liquid
Phase Changes & Phase Diagrams • Sublimation • Solid Gas • Deposition • Gas Solid
Phase Changes & Phase Diagrams • Every phase change is accompanied by a change in the energy of the system. • Heat of fusion (DHfus) • Enthalpy change required to change a solid at its melting point to a liquid at the same temperature • Heat of vaporization (DHvap) • Enthalpy change required to change a liquid at its boiling point to a gas at the same temperature
Phase Changes & Phase Diagrams • Heat of Sublimation (DHsub) • Enthalpy change required to transform a solid directly into the gas phase • During a phase change, the two phases exist in equilibrium. • At the melting point, solid and liquid phases are in equilibrium. • At the boiling point, liquid and gas phases are in equilibrium.
Phase Changes & Phase Diagrams • The heat added to the system at the melting and boiling points goes into pulling the molecules farther apart from each other. • The temperature of the substance does not rise during a phase change.
Phase Changes & Phase Diagrams Example: Calculate the enthalpy change associated with converting 12.0 g of ice at -15oC to steam (water vapor) at 115oC under a constant pressure of one atmosphere. The specific heats of ice, water, and steam are 2.09J/g-K, 4.18 J/g-K, and 1.84 J/g-K, respectively. For water, DHfus = 6.01 kJ/mol and DHvap = 40.67 kJ/mol.
Phase Changes & Phase Diagrams • A B: Ice is heating from -15oC to 0.oC with no change in state • Use specific heat of ice to determine q (from -15 to 0.oC) • qA B =
Phase Changes & Phase Diagrams • B C: Ice is melting with no change in T • Use heat of fusion • qB C =
Phase Changes & Phase Diagrams • C D: Water is heating from 0. to 100.oC with no change in state • Use specific heat of water to determine q (from 0. to 100. oC) • qC D =
Phase Changes & Phase Diagrams • D E: Water is boiling with no change in T • Use heat of vaporization • qD E =
Phase Changes & Phase Diagrams • E F: Steam is heating from 100. to 115oC with no change in state • Use specific heat of steam to determine q (from 100. to 115oC) • qE F =
Phase Changes & Phase Diagrams • DHA F = = 36.8 kJ
Phase Changes & Phase Diagrams • What would you do differently if the problem asked to calculate the enthalpy change to convert 12.0 g of steam at 115oC to ice at -115oC? • You should be able to handle both types of problems.
Phase Changes and Phase Diagrams • Liquid-Vapor Equilibrium • Molecules can escape from the surface of a liquid by evaporation. • In a closed container, molecules in the gas phase cannot escape, and the pressure exerted by the vapor in the “headspace” begins to increase.
Phase Changes and Phase Diagrams • Liquid-Vapor Equilibrium • The liquid and vapor reach a state of dynamic equilibrium: • liquid molecules evaporate and vapor molecules condenseat the same rate. • The vapor pressure reaches a constant value. • Vapor pressure: pressure exerted by a vapor when the liquid and vapor states are in dynamic equilibrium.
Phase Changes and Phase Diagrams • In general, the vapor pressure of a liquid increases with increasing temperature. • Substances with higher vapor pressures (and lower boiling points) are more volatile. • Volatile: • evaporates easily.
Phase Changes and Phase Diagrams Example: Which of the compounds on the previous slide is most volatile at room temperature: diethyl ether, ethyl alcohol, or water? Which one has the strongest intermolecular forces? (How do you know?) What types of intermolecular forces exist in each molecule. Most volatile: Strongest intermolecular forces: Type of forces:
Phase Changes and Phase Diagrams Why does water boil at 94.5oC in Santa Fe, New Mexico whereas it boils at 100.0oC in OKC?
Phase Changes and Phase Diagrams • Boiling point: • the temperature at which the vapor pressure of a liquid equals atmospheric pressure. • Normal boiling point: • the temperature at which the vapor pressure of a liquid equals 760. torr or 1 atm
Phase Changes and Phase Diagrams Example: Use the graph of vapor pressure as a function of temperature to predict the normal boiling point of diethyl ether and its approximate boiling point at 200 torr and at 1000 torr. Normal BP = BP @ 200 torr = BP @ 1000 torr =
Phase Changes and Phase Diagrams Example: Bromine has a normal boiling point of 332.0K while iodine has a normal boiling point of 457.6K. Which is more volatile at room temperature? Which one has the weakest intermolecular forces at RT? Most volatile: Weakest Intermolecular forces:
Phase Changes and Phase Diagrams • Dynamic equilibria can exist between other states of matter. • A phase diagram for a substance illustrates: • its physical state at various T and P • the equilibria that exist between phases
Phase Changes and Phase Diagrams • The AB line is the liquid-vapor interface. • It starts at the triple point (A) • the point at which all three states are in equilibrium.
Phase Changes and Phase Diagrams • It ends at the critical point (B); • the temperature (critical temperature) and pressure (critical pressure) above which the liquid and vapor are indistinguishable from each other
Phase Changes and Phase Diagrams • Each point along this line is the boiling point of the substance at that pressure.
Phase Changes and Phase Diagrams • The AD line is the interface between liquid and solid. • The melting point at each pressure can be found along this line.
Phase Changes and Phase Diagrams • Below A the substance cannot exist in the liquid state. • Along theAC line the solid and gas phases are in equilibrium • The sublimation point at each pressure is along this line.
Phase Changes and Phase Diagrams Example: Given the phase diagram for water, which point represents: • the normal boiling point of water • the normal melting point of water • the critical point of water • the triple point of water
Phase Changes and Phase Diagrams Example: Given the phase diagram for carbon dioxide, which line represents the equilibrium between: • Solid and liquid? • Liquid and gas? • Solid and gas?
Phase Changes and Phase Diagrams Example: Using this phase diagram for water, describe the changes in physical state that occur when water is maintained at 0oC while the pressure decreases from that at point 5 to that at point 1. 5: 4: 3: 2: 1:
Phase Changes and Phase Diagrams Example: Using this phase diagram for water, describe the changes in physical state that occur when water is kept at 1 atm pressure while the temperature decreases from that at point 9 to that at point 6. 9: 8: 7: 4: 6: