Random Variables in Statistical Analysis
Explore discrete and continuous random variables, probability distributions, uniform and normal distributions, and how to calculate probabilities for specific intervals. Learn how to interpret density curves and apply formulas effectively.

Random Variables in Statistical Analysis
E N D
Presentation Transcript
Problems Problems 4.62, 4.64, 4.66, 4.68
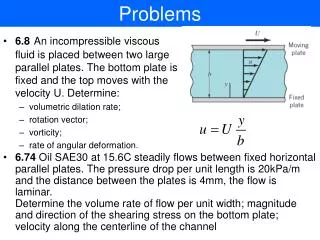
4. Random Variables A random variable is a way of recording a quantitative variable of a random experiment.
4. Random Variables A random variable is a way of recording a quantitative variable of a random experiment. In particular Chapter 4 talks about discrete random variables.
4. Random Variables A random variable is a way of recording a quantitative variable of a random experiment. In particular Chapter 4 talks about discrete random variables. If a random variable has a particular distribution (such as a binomial distribution) then our work becomes easier. We use formulas and tables.
5. Continuous Random Variables A random variable is a way of recording a quantitative variable of a random experiment. In particular Chapter 4 talks about discrete random variables. If a random variable has a particular distribution (such as a binomial distribution) then our work becomes easier. We use formulas and tables.
5. Continuous Random Variables A random variable where X can take on a range of values, not just particular ones. Examples: Heights Distance a golfer hits the ball with their driver Time to run 100 meters Electricity usage of a home.
5. Continuous Random Variables There are two types of continuous distributions we discuss now: uniform and normal distributions.
5. Continuous Random Variables There are two types of continuous distributions we discuss now: uniform and normal distributions. A density curveis the graph of a continuous probability distribution.
5. Continuous Random Variables There are two types of continuous distributions we discuss now: uniform and normal distributions. A density curveis the graph of a continuous probability distribution. 1) This curve always positive (or 0) 2) The area under the curve is 1.
Uniform Distribution A Uniform Distributionhas equally likely values over the range of possible outcomes.
Uniform Distribution A Uniform Distributionhas equally likely values over the range of possible outcomes. A graph of the uniform probability distribution is a rectangle with area equal to 1.
P(x) 0.2 0 x 0 1 2 3 4 5 Temperature (degrees Celsius) Example The figure below depicts the probability distribution for temperatures in a manufacturing process. The temperatures are controlled so that they range between 0 and 5 degrees Celsius, and every possible temperature is equally likely.
P(x) 0.2 0 x 0 1 2 3 4 5 Temperature (degrees Celsius) Example What is the Probability that the temperature is exactly 4 degrees?
P(x) 0.2 0 x 0 1 2 3 4 5 Temperature (degrees Celsius) Example What is the Probability that the temperature is exactly 4 degrees? Answer: 0
Example Since we have a continuous random variable there are an infinite number of possible outcomes between 0 and 5, the probability of one number out of an infinite set of numbers is 0.
Example Since we have a continuous random variable there are an infinite number of possible outcomes between 0 and 5, the probability of one number out of an infinite set of numbers is 0.What we can do is find probabilities over intervals?
P(x) 0.2 0 x 0 1 2 3 4 5 Temperature (degrees Celsius) Example What is the probability the temperature is between 10C and 40C?
P(x) 0.2 0 x 0 1 2 3 4 5 Temperature (degrees Celsius) Example What is the probability the temperature is between 10C and 40C?
P(x) 0.2 0 x 0 1 2 3 4 5 Temperature (degrees Celsius) What is the probability the temperature is between 10C and 40C? We know that the total area of the rectangle is 1, and we can see that the part of the rectangle between 1 and 4 is 3/5 of the total, so P(1 x 4) = 3/5*(1) = 0.6.
P(x) 0.2 0 x 0 1 2 3 4 5 Temperature (degrees Celsius) We know that the total area of the rectangle is 1, and we can see that the part of the rectangle between 1 and 4 is 3/5 of the total, so P(1 x 4) = 3/5*(1) = 0.6. In general this can be found by looking at the area under this curve between x=1 and x=4.
Probabilities and Area For a density curve depicting the probability distribution of a continuous random variable, • the total area under the curve is 1, • there is a direct correspondence between area and probability. • Only the probability of an event occurring in some interval can be evaluated. • The probability that a continuous random variable takes on any particular value is zero.
Uniform Distribution A Uniform Distributionhas equally likely values over the range of possible outcomes, say c to d.
Normal Distributions This is the most common observed distribution of continuous random variables. A normal distribution corresponds to bell-shaped curves.
Normal Distributions This is the most common observed distribution of continuous random variables. A normal distribution corresponds to bell-shaped curves.
Examples The following are examples of normally distributed everyday data. • Grades on a test. • How many chips are in a small bag of potatoe chips. • The measurements of distance between two points. • The heights of students in this class.
Normal Distributions Shape of this curve is determined by µ and σ • µ it’s centered, σ is how far it’s spread out.
Standard Normal Distribution The Standard Normal Distributionis a normal probability distribution that has a mean of 0 and a standard deviation of 1.m = 0, s = 1 In this way the formula giving the heights of the normal curve is simplified greatly.
Z-score We represent a standard normal variable with a z instead of an x. Convert any normal distribution to a standard normal distribution by using the z-score.
Standard Normal Probabilities P(0 z 1) represents the probability that z takes on values between 0 and 1, which is represented by the area under the curve between 0 and 1. P(0 z 1) = 0.3413
Finding Probabilities when given z-scores. For a given z-score, the probability can be found in a table in the back of the text (Table IV), also see inside front cover. Note: The table only gives the areas under the curve to the right between 0 and z. To find other intervals requires some tricks.
Examples Use the tables in the back of the book to find the following. a) P(0 z 2.43) b) P(-2.43 z 0) c) P(1.20 z 2.30) d) P(-1.50 z 2.4) e) P( z 1.8)
Problems Problems 5.3, 5.4, 5.12 Problems 5.22, 5.26, 5.28, 5.30, 5.36, 5.40, 5.48
Keys to success Learn the standard normal table and how to use it. We will be using these tables through out the course.
Homework • Review Chapter 5.1-5.2 • Read Chapters 5.3, 5.4, 6.1, 6.2 • Assignment due Friday at noon