Download
1 / 24
240 likes | 337 Views
Investigating high-lying rotational levels of water, crucial for understanding spectra at high temperature and around supergiant stars and gas-giant planets. Experimental data, theoretical approach, line position analysis, and comparison with other data are discussed. Advanced spectroscopy techniques and results are presented.

E N D
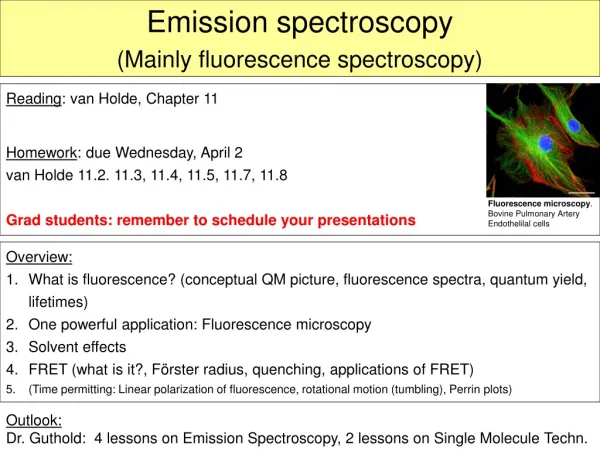
High-Lying Rotational Levelsof Water obtained by FIREmission Spectroscopy L. H. Coudert,a M.-A. Martin,b O. Pirali,b D. Balcon,b and M. Vervloetb aLISA, CNRS/Universities Paris Est and Paris Diderot, Créteil, France bLigne AILES - Synchrotron SOLEIL, Gif-sur-Yvette, France
Why High-lying Rotational levels? Spectrum of water at high temperature Water at a temperature of 1500 K has been detected around supergiant stars.1 Hot water is expected to be found in extrasolar gas-giant planets like HD 209458b2-3 characterized by a temperature of 1500 K. 1T. Tsuji, ApJ.540 (2000) L99 2http://www.nasa.gov/centers/godard/new/topstory/2007/cloudy_world.html 3http://www.nasa.gov/vision/universe/newworlds/Osiris_leaks.html
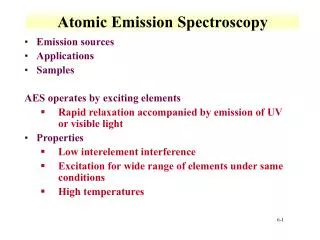
Overview • The new experimental data • The line position analysis • The data set • Results • Comparison with other data bases • Line strength comparison
Radio Frequency discharge Experimental setup Bruker IFS 125 Fourier transform interferometer of the Ailes beam line at Soleil
Faraday cage Fan Pyrex cell Radio frequency discharge F = 13.6 MHz Power = 1000 W Pressures = 10 and 15 Torr Temperature 1000 K
660 550 (000) 853 744 (001) 1249 1138 (000) Low pressure spectrum A
1212,1 1111,0 (001) 1210,3 1192 (000) High pressure spectrum A
The assigned lines Up to the 2nd triad, number of assigned lines is 6444 There are also lines for the first hexad
The theoretical approach The bending-rotation approach has been used to fit the new data. It accounts for the anomalous centrifugal distortion and has already been used in many investigations1-8and for the MIPAS9and HITRAN10,11data bases. The bending-rotation approach makes use of Radau Coordinates 1. J. Mol. Spec.154 (1992) 427. 2. J. Mol. Spec.165 (1994) 406. 3.J. Mol. Spec.181 (1997) 246. 4.J. Mol. Spec. 195 (1999) 54. 5.Mol. Phys.96 (1999) 941. 6.J. Mol. Spec.206 (2001) 83. 7.J. Mol. Spec.228 (2004) 471. 8.J. Mol. Spec.251 (2008) 339. 9. J. Atmos. Oceanic Opt.16 (2003) 172. 10.J. Q. S. R. T.96 (2005) 139. 11.J. Q. S. R. T.110 (2009) 533.
Line position analysis The data considered in a previous investigation1 and the 6444 newly measured lines were fitted. 22986 data fitted Unitless Standard deviation is 1.2 336 parameters determined 1.Coudert, Wagner, Birk, Baranov, Lafferty, and Flaud, J. Mol. Spec.251 (2008) 339.
Analysis results for the new data UNC & RMS are in 10-3 cm-1
Residuals plot The anomalous centrifugal distortion is accounted for
Comparison with other calculations The residuals obtained with the present approach will be compared to those obtained with: • Hitran1 • Partridge & Schwenke2 • Barber et al.3 1.Rothman et al., J. Q. S. R. T.110 (2009) 533 2.Partridge and Schwenke, J. Chem. Phys.106 (1997) 4618 3.Barber, Tennyson, Harris, and Tolchenov, M. N. R. A. S.368 (2006) 1087
Residuals plot with Hitran Only 265 transitions out of 590. RMS = 0.0006 cm-1
Comparison with P. & S. Transitions wavenumbers were calculated from the energy levels given by Partridge and Schwenke.1 1.Partridge and Schwenke, J. Chem. Phys.106 (1997) 4618
Residuals plot with P. & S. levels 529 transitions. RMS = 0.015 cm-1
Residuals plot with P. & S. levels 378 out of 382. RMS = 0.02 cm-1
Comparison with Barber et al. Transitions wavenumbers were calculated from the energy levels computed by Barber et al.1 available in 2. 1.Barber, Tennyson, Harris, and Tolchenov, M. N. R. A. S.368 (2006) 1087 2. http://www.tampa.phys.ucl.ac.uk/ftp/astrodata/water/BT2
Residuals plot with Barber et al. levels 528 transitions. RMS = 0.049 cm-1
RMS values Values are in 10-3 cm-1 Outliers are not taken into account.
Line strengths The lines intensity data considered in the previous investigation1 were re-fitted. Einstein’s A-coefficients were calculated. Several emission spectra were computed. 1.Coudert, Wagner, Birk, Baranov, Lafferty, and Flaud, J. Mol. Spec.251 (2008) 339.
Spectra comparison Observed Calculated T = 1000K, Gaussian line profile, Hwhh = 0.007 cm-1