Download
1 / 42
430 likes | 596 Views
Sequence motifs, and sequence logos, Neural networks. Ole Lund, Morten Nielsen, CBS, Department of Systems Biology, DTU. Informatics in biology. 70’ Little computing power Analytical solutions 80’ Computers, few data Simulations of molecular/cellular dynamics

E N D
Sequence motifs, and sequence logos, Neural networks Ole Lund, Morten Nielsen, CBS, Department of Systems Biology, DTU
Informatics in biology • 70’ Little computing power • Analytical solutions • 80’ Computers, few data • Simulations of molecular/cellular dynamics • 90’ More data – Sequence and structure • Searching biological databases • Prediction of features by data driven methods • Analysis of gene expression data >polymerase“ MERIKELRDLMSQSRTREILTKTTVDHMAIIKKYTSGRQEKNPALRMKWMMAMKYPITAD KRIMEMIPERNEQGQTLWSKTNDAGSDRVMVSPLAVTWWNRNGPTTSTVHYPKVYKTYFE KVERLKHGTFGPVHFRNQVKIRRRVDINPGHADLSAKEAQDVIMEVVFPNEVGARILTSE SQLTITKEKKEELQDCKIAPLMVAYMLERELVRKTRFLPVAGGTSSVYIEVLHLTQGTCW EQMYTPGGEVRNDDVDQSLIIAARNIVRRATVSADPLASLLEMCHSTQIGGIRMVDILRQ NPTEEQAVDICKAAMGLRISSSFSFGGFTFKRTNGSSVKKEEEVLTGNLQTLKIKVHEGY EEFTMVGRRATAILRKATRRLIQLIVSGRDEQSIAEAIIVAMVFSQEDCMIKAVRGDLNF ...
Data driven predictions YMNGTMSQV GILGFVFTL ALWGFFPVV ILKEPVHGV ILGFVFTLT LLFGYPVYV GLSPTVWLS WLSLLVPFV FLPSDFFPS CVGGLLTMV FIAGNSAYE List of peptides that have a given biological feature Mathematical model (neural network, hidden Markov model) Search databases for other biological sequences with the same feature/property >polymerase“ MERIKELRDLMSQSRTREILTKTTVDHMAIIKKYTSGRQEKNPALRMKWMMAMKYPITAD KRIMEMIPERNEQGQTLWSKTNDAGSDRVMVSPLAVTWWNRNGPTTSTVHYPKVYKTYFE KVERLKHGTFGPVHFRNQVKIRRRVDINPGHADLSAKEAQDVIMEVVFPNEVGARILTSE SQLTITKEKKEELQDCKIAPLMVAYMLERELVRKTRFLPVAGGTSSVYIEVLHLTQGTCW EQMYTPGGEVRNDDVDQSLIIAARNIVRRATVSADPLASLLEMCHSTQIGGIRMVDILRQ NPTEEQAVDICKAAMGLRISSSFSFGGFTFKRTNGSSVKKEEEVLTGNLQTLKIKVHEGY EEFTMVGRRATAILRKATRRLIQLIVSGRDEQSIAEAIIVAMVFSQEDCMIKAVRGDLNF ...
Prediction algorithms MHC binding data Prediction algorithms Genome scans
Influenza A virus (A/Goose/Guangdong/1/96(H5N1)) Genome >Segment 1 agcaaaagcaggtcaattatattcaatatggaaagaataaaagaactaagagatctaatg tcgcagtcccgcactcgcgagatactaacaaaaaccactgtggatcatatggccataatc aagaaatacacatcaggaagacaagagaagaaccctgctctcagaatgaaatggatgatg gcaatgaaatatccaatcacagcagacaagagaataatggagatgattcctgaaaggaat and 13350 other nucleotides on 8 segments 9mer peptides Proteins >polymerase“ MERIKELRDLMSQSRTREILTKTTVDHMAIIKKYTSGRQEKNPALRMKWMMAMKYPITAD KRIMEMIPERNEQGQTLWSKTNDAGSDRVMVSPLAVTWWNRNGPTTSTVHYPKVYKTYFE KVERLKHGTFGPVHFRNQVKIRRRVDINPGHADLSAKEAQDVIMEVVFPNEVGARILTSE SQLTITKEKKEELQDCKIAPLMVAYMLERELVRKTRFLPVAGGTSSVYIEVLHLTQGTCW EQMYTPGGEVRNDDVDQSLIIAARNIVRRATVSADPLASLLEMCHSTQIGGIRMVDILRQ NPTEEQAVDICKAAMGLRISSSFSFGGFTFKRTNGSSVKKEEEVLTGNLQTLKIKVHEGY EEFTMVGRRATAILRKATRRLIQLIVSGRDEQSIAEAIIVAMVFSQEDCMIKAVRGDLNF ... and 9 other proteins MERIKELRD ERIKELRDL RIKELRDLM IKELRDLMS KELRDLMSQ ELRDLMSQS LRDLMSQSR RDLMSQSRT DLMSQSRTR LMSQSRTRE and 4376 other 9mers
Immune system • Innate – fast… • Addaptive – remembers… • Cellular • Cytotoxic T lymphocytes (CTL) • Helper T lymphocytes (HTL) • Humoral • B lymphocytes Figure by Eric A.J. Reits
Pattern recognition Regular expressions and probabilities Information content Sequence logos Multiple alignment and sequence motifs Weight matrix construction Sequence weighting Low (pseudo) counts Examples from the real world Sequence profiles Outline
MHC-I molecules present peptides on the surface of most cells
CTL response Virus- infected cell Healthy cell MHC-I
CTL response Virus- infected cell Healthy cell MHC-I
Anchor positions Binding Motif. MHC class I with peptide
Sequence information SLLPAIVEL YLLPAIVHI TLWVDPYEV GLVPFLVSV KLLEPVLLL LLDVPTAAV LLDVPTAAV LLDVPTAAV LLDVPTAAV VLFRGGPRG MVDGTLLLL YMNGTMSQV MLLSVPLLL SLLGLLVEV ALLPPINIL TLIKIQHTL HLIDYLVTS ILAPPVVKL ALFPQLVIL GILGFVFTL STNRQSGRQ GLDVLTAKV RILGAVAKV QVCERIPTI ILFGHENRV ILMEHIHKL ILDQKINEV SLAGGIIGV LLIENVASL FLLWATAEA SLPDFGISY KKREEAPSL LERPGGNEI ALSNLEVKL ALNELLQHV DLERKVESL FLGENISNF ALSDHHIYL GLSEFTEYL STAPPAHGV PLDGEYFTL GVLVGVALI RTLDKVLEV HLSTAFARV RLDSYVRSL YMNGTMSQV GILGFVFTL ILKEPVHGV ILGFVFTLT LLFGYPVYV GLSPTVWLS WLSLLVPFV FLPSDFFPS CLGGLLTMV FIAGNSAYE KLGEFYNQM KLVALGINA DLMGYIPLV RLVTLKDIV MLLAVLYCL AAGIGILTV YLEPGPVTA LLDGTATLR ITDQVPFSV KTWGQYWQV TITDQVPFS AFHHVAREL YLNKIQNSL MMRKLAILS AIMDKNIIL IMDKNIILK SMVGNWAKV SLLAPGAKQ KIFGSLAFL ELVSEFSRM KLTPLCVTL VLYRYGSFS YIGEVLVSV CINGVCWTV VMNILLQYV ILTVILGVL KVLEYVIKV FLWGPRALV GLSRYVARL FLLTRILTI HLGNVKYLV GIAGGLALL GLQDCTMLV TGAPVTYST VIYQYMDDL VLPDVFIRC VLPDVFIRC AVGIGIAVV LVVLGLLAV ALGLGLLPV GIGIGVLAA GAGIGVAVL IAGIGILAI LIVIGILIL LAGIGLIAA VDGIGILTI GAGIGVLTA AAGIGIIQI QAGIGILLA KARDPHSGH KACDPHSGH ACDPHSGHF SLYNTVATL RGPGRAFVT NLVPMVATV GLHCYEQLV PLKQHFQIV AVFDRKSDA LLDFVRFMG VLVKSPNHV GLAPPQHLI LLGRNSFEV PLTFGWCYK VLEWRFDSR TLNAWVKVV GLCTLVAML FIDSYICQV IISAVVGIL VMAGVGSPY LLWTLVVLL SVRDRLARL LLMDCSGSI CLTSTVQLV VLHDDLLEA LMWITQCFL SLLMWITQC QLSLLMWIT LLGATCMFV RLTRFLSRV YMDGTMSQV FLTPKKLQC ISNDVCAQV VKTDGNPPE SVYDFFVWL FLYGALLLA VLFSSDFRI LMWAKIGPV SLLLELEEV SLSRFSWGA YTAFTIPSI RLMKQDFSV RLPRIFCSC FLWGPRAYA RLLQETELV SLFEGIDFY SLDQSVVEL RLNMFTPYI NMFTPYIGV LMIIPLINV TLFIGSHVV SLVIVTTFV VLQWASLAV ILAKFLHWL STAPPHVNV LLLLTVLTV VVLGVVFGI ILHNGAYSL MIMVKCWMI MLGTHTMEV MLGTHTMEV SLADTNSLA LLWAARPRL GVALQTMKQ GLYDGMEHL KMVELVHFL YLQLVFGIE MLMAQEALA LMAQEALAF VYDGREHTV YLSGANLNL RMFPNAPYL EAAGIGILT TLDSQVMSL STPPPGTRV KVAELVHFL IMIGVLVGV ALCRWGLLL LLFAGVQCQ VLLCESTAV YLSTAFARV YLLEMLWRL SLDDYNHLV RTLDKVLEV GLPVEYLQV KLIANNTRV FIYAGSLSA KLVANNTRL FLDEFMEGV ALQPGTALL VLDGLDVLL SLYSFPEPE ALYVDSLFF SLLQHLIGL ELTLGEFLK MINAYLDKL AAGIGILTV FLPSDFFPS SVRDRLARL SLREWLLRI LLSAWILTA AAGIGILTV AVPDEIPPL FAYDGKDYI AAGIGILTV FLPSDFFPS AAGIGILTV FLPSDFFPS AAGIGILTV FLWGPRALV ETVSEQSNV ITLWQRPLV
Calculate pa at each position Entropy Information content Conserved positions PV=1, P!v=0 => S=0, I=log(20) Mutable positions Paa=1/20 => S=log(20), I=0 Say that a peptide must have L at P2 in order to bind, and that A,F,W,and Y are found at P1. Which position has most information? How many questions do I need to ask to tell if a peptide binds looking at only P1 or P2? P1: 4 questions (at most) P2: 1 question (L or not) P2 has the most information Sequence Information
Information content A R N D C Q E G H I L K M F P S T W Y V S I 1 0.10 0.06 0.01 0.02 0.01 0.02 0.02 0.09 0.01 0.07 0.11 0.06 0.04 0.08 0.01 0.11 0.03 0.01 0.05 0.08 3.96 0.37 2 0.07 0.00 0.00 0.01 0.01 0.00 0.01 0.01 0.00 0.08 0.59 0.01 0.07 0.01 0.00 0.01 0.06 0.00 0.01 0.08 2.16 2.16 3 0.08 0.03 0.05 0.10 0.02 0.02 0.01 0.12 0.02 0.03 0.12 0.01 0.03 0.05 0.06 0.06 0.04 0.04 0.04 0.07 4.06 0.26 4 0.07 0.04 0.02 0.11 0.01 0.04 0.08 0.15 0.01 0.10 0.04 0.03 0.01 0.02 0.09 0.07 0.04 0.02 0.00 0.05 3.87 0.45 5 0.04 0.04 0.04 0.04 0.01 0.04 0.05 0.16 0.04 0.02 0.08 0.04 0.01 0.06 0.10 0.02 0.06 0.02 0.05 0.09 4.04 0.28 6 0.04 0.03 0.03 0.01 0.02 0.03 0.03 0.04 0.02 0.14 0.13 0.02 0.03 0.07 0.03 0.05 0.08 0.01 0.03 0.15 3.92 0.40 7 0.14 0.01 0.03 0.03 0.02 0.03 0.04 0.03 0.05 0.07 0.15 0.01 0.03 0.07 0.06 0.07 0.04 0.03 0.02 0.08 3.98 0.34 8 0.05 0.09 0.04 0.01 0.01 0.05 0.07 0.05 0.02 0.04 0.14 0.04 0.02 0.05 0.05 0.08 0.10 0.01 0.04 0.03 4.04 0.28 9 0.07 0.01 0.00 0.00 0.02 0.02 0.02 0.01 0.01 0.08 0.26 0.01 0.01 0.02 0.00 0.04 0.02 0.00 0.01 0.38 2.78 1.55
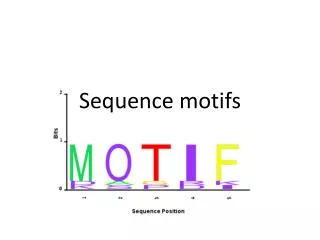
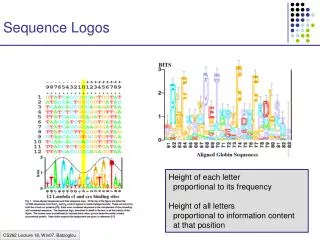
Sequence logos • Height of a column equal to I • Relative height of a letter is p • Highly useful tool to visualize sequence motifs HLA-A0201 High information positions http://www.cbs.dtu.dk/~gorodkin/appl/plogo.html
Characterizing a binding motif from small data sets 10 MHC restricted peptides • What can we learn? • A at P1 favors binding? • I is not allowed at P9? • K at P4 favors binding? • Which positions are important for binding? ALAKAAAAM ALAKAAAAN ALAKAAAAR ALAKAAAAT ALAKAAAAV GMNERPILT GILGFVFTM TLNAWVKVV KLNEPVLLL AVVPFIVSV
ALAKAAAAM ALAKAAAAN ALAKAAAAR ALAKAAAAT ALAKAAAAV GMNERPILT GILGFVFTM TLNAWVKVV KLNEPVLLL AVVPFIVSV Simple motifs Yes/No rules 10 MHC restricted peptides • Only 11 of 212 peptides identified! • Need more flexible rules • If not fit P1 but fit P2 then ok • Not all positions are equally important • We know that P2 and P9 determines binding more than other positions • Cannot discriminate between good and very good binders
Simple motifsYes/No rules 10 MHC restricted peptides ALAKAAAAM ALAKAAAAN ALAKAAAAR ALAKAAAAT ALAKAAAAV GMNERPILT GILGFVFTM TLNAWVKVV KLNEPVLLL AVVPFIVSV • Example • Two first peptides will not fit the motif. They are all good binders (aff< 500nM) RLLDDTPEV 84 nM GLLGNVSTV 23 nM ALAKAAAAL 309 nM
Fitness of aa at each position given by P(aa) Example P1 PA = 6/10 PG = 2/10 PT = PK = 1/10 PC = PD = …PV = 0 Problems Few data Data redundancy/duplication ALAKAAAAM ALAKAAAAN ALAKAAAAR ALAKAAAAT ALAKAAAAV GMNERPILT GILGFVFTM TLNAWVKVV KLNEPVLLL AVVPFIVSV Extended motifs RLLDDTPEV 84 nM GLLGNVSTV 23 nM ALAKAAAAL 309 nM
Sequence informationRaw sequence counting ALAKAAAAM ALAKAAAAN ALAKAAAAR ALAKAAAAT ALAKAAAAV GMNERPILT GILGFVFTM TLNAWVKVV KLNEPVLLL AVVPFIVSV
ALAKAAAAM ALAKAAAAN ALAKAAAAR ALAKAAAAT ALAKAAAAV GMNERPILT GILGFVFTM TLNAWVKVV KLNEPVLLL AVVPFIVSV Sequence weighting } Similar sequences Weight 1/5 • Poor or biased sampling of sequence space • Example P1 • PA = 2/6 • PG = 2/6 • PT = PK = 1/6 • PC = PD = …PV = 0 RLLDDTPEV 84 nM GLLGNVSTV 23 nM ALAKAAAAL 309 nM
Sequence weighting ALAKAAAAM ALAKAAAAN ALAKAAAAR ALAKAAAAT ALAKAAAAV GMNERPILT GILGFVFTM TLNAWVKVV KLNEPVLLL AVVPFIVSV
ALAKAAAAM ALAKAAAAN ALAKAAAAR ALAKAAAAT ALAKAAAAV GMNERPILT GILGFVFTM TLNAWVKVV KLNEPVLLL AVVPFIVSV Pseudo counts • I is not found at position P9. Does this mean that I is forbidden (P(I)=0)? • No! Use Blosum substitution matrix to estimate pseudo frequency of I at P9
The Blosum matrix A R N D C Q E G H I L K M F P S T W Y V A 0.29 0.03 0.03 0.03 0.02 0.03 0.04 0.08 0.01 0.04 0.06 0.04 0.02 0.02 0.03 0.09 0.05 0.01 0.02 0.07 R 0.04 0.34 0.04 0.03 0.01 0.05 0.05 0.03 0.02 0.02 0.05 0.12 0.02 0.02 0.02 0.04 0.03 0.01 0.02 0.03 N 0.04 0.04 0.32 0.08 0.01 0.03 0.05 0.07 0.03 0.02 0.03 0.05 0.01 0.02 0.02 0.07 0.05 0.00 0.02 0.03 D 0.04 0.03 0.07 0.40 0.01 0.03 0.09 0.05 0.02 0.02 0.03 0.04 0.01 0.01 0.02 0.05 0.04 0.00 0.01 0.02 C 0.07 0.02 0.02 0.02 0.48 0.01 0.02 0.03 0.01 0.04 0.07 0.02 0.02 0.02 0.02 0.04 0.04 0.00 0.01 0.06 Q 0.06 0.07 0.04 0.05 0.01 0.21 0.10 0.04 0.03 0.03 0.05 0.09 0.02 0.01 0.02 0.06 0.04 0.01 0.02 0.04 E 0.06 0.05 0.04 0.09 0.01 0.06 0.30 0.04 0.03 0.02 0.04 0.08 0.01 0.02 0.03 0.06 0.04 0.01 0.02 0.03 G 0.08 0.02 0.04 0.03 0.01 0.02 0.03 0.51 0.01 0.02 0.03 0.03 0.01 0.02 0.02 0.05 0.03 0.01 0.01 0.02 H 0.04 0.05 0.05 0.04 0.01 0.04 0.05 0.04 0.35 0.02 0.04 0.05 0.02 0.03 0.02 0.04 0.03 0.01 0.06 0.02 I 0.05 0.02 0.01 0.02 0.02 0.01 0.02 0.02 0.01 0.27 0.17 0.02 0.04 0.04 0.01 0.03 0.04 0.01 0.02 0.18 L 0.04 0.02 0.01 0.02 0.02 0.02 0.02 0.02 0.01 0.12 0.38 0.03 0.05 0.05 0.01 0.02 0.03 0.01 0.02 0.10 K 0.06 0.11 0.04 0.04 0.01 0.05 0.07 0.04 0.02 0.03 0.04 0.28 0.02 0.02 0.03 0.05 0.04 0.01 0.02 0.03 M 0.05 0.03 0.02 0.02 0.02 0.03 0.03 0.03 0.02 0.10 0.20 0.04 0.16 0.05 0.02 0.04 0.04 0.01 0.02 0.09 F 0.03 0.02 0.02 0.02 0.01 0.01 0.02 0.03 0.02 0.06 0.11 0.02 0.03 0.39 0.01 0.03 0.03 0.02 0.09 0.06 P 0.06 0.03 0.02 0.03 0.01 0.02 0.04 0.04 0.01 0.03 0.04 0.04 0.01 0.01 0.49 0.04 0.04 0.00 0.01 0.03 S 0.11 0.04 0.05 0.05 0.02 0.03 0.05 0.07 0.02 0.03 0.04 0.05 0.02 0.02 0.03 0.22 0.08 0.01 0.02 0.04 T 0.07 0.04 0.04 0.04 0.02 0.03 0.04 0.04 0.01 0.05 0.07 0.05 0.02 0.02 0.03 0.09 0.25 0.01 0.02 0.07 W 0.03 0.02 0.02 0.02 0.01 0.02 0.02 0.03 0.02 0.03 0.05 0.02 0.02 0.06 0.01 0.02 0.02 0.49 0.07 0.03 Y 0.04 0.03 0.02 0.02 0.01 0.02 0.03 0.02 0.05 0.04 0.07 0.03 0.02 0.13 0.02 0.03 0.03 0.03 0.32 0.05 V 0.07 0.02 0.02 0.02 0.02 0.02 0.02 0.02 0.01 0.16 0.13 0.03 0.03 0.04 0.02 0.03 0.05 0.01 0.02 0.27 Some amino acids are highly conserved (i.e. C), some have a high change of mutation (i.e. I)
What is a pseudo count? • Say V is observed at P2 • Knowing that V at P2 binds, what is the probability that a peptide could have I at P2? • P(I|V) = 0.16 A R N D C Q E G H I L K M F P S T W Y V A 0.29 0.03 0.03 0.03 0.02 0.03 0.04 0.08 0.01 0.04 0.06 0.04 0.02 0.02 0.03 0.09 0.05 0.01 0.02 0.07 R 0.04 0.34 0.04 0.03 0.01 0.05 0.05 0.03 0.02 0.02 0.05 0.12 0.02 0.02 0.02 0.04 0.03 0.01 0.02 0.03 N 0.04 0.04 0.32 0.08 0.01 0.03 0.05 0.07 0.03 0.02 0.03 0.05 0.01 0.02 0.02 0.07 0.05 0.00 0.02 0.03 D 0.04 0.03 0.07 0.40 0.01 0.03 0.09 0.05 0.02 0.02 0.03 0.04 0.01 0.01 0.02 0.05 0.04 0.00 0.01 0.02 C 0.07 0.02 0.02 0.02 0.48 0.01 0.02 0.03 0.01 0.04 0.07 0.02 0.02 0.02 0.02 0.04 0.04 0.00 0.01 0.06 …. Y 0.04 0.03 0.02 0.02 0.01 0.02 0.03 0.02 0.05 0.04 0.07 0.03 0.02 0.13 0.02 0.03 0.03 0.03 0.32 0.05 V 0.07 0.02 0.02 0.02 0.02 0.02 0.02 0.02 0.01 0.16 0.13 0.03 0.03 0.04 0.02 0.03 0.05 0.01 0.02 0.27
Pseudo count estimation ALAKAAAAM ALAKAAAAN ALAKAAAAR ALAKAAAAT ALAKAAAAV GMNERPILT GILGFVFTM TLNAWVKVV KLNEPVLLL AVVPFIVSV • Calculate observed amino acids frequencies fa • Pseudo frequency for amino acid b • Example
Weight on pseudo count ALAKAAAAM ALAKAAAAN ALAKAAAAR ALAKAAAAT ALAKAAAAV GMNERPILT GILGFVFTM TLNAWVKVV KLNEPVLLL AVVPFIVSV • Pseudo counts are important when only limited data is available • With large data sets only “true” observation should count • is the effective number of sequences (= Number of sequence - 1) • is the weight on prior or weight on pseudo counts
Weight on pseudo count ALAKAAAAM ALAKAAAAN ALAKAAAAR ALAKAAAAT ALAKAAAAV GMNERPILT GILGFVFTM TLNAWVKVV KLNEPVLLL AVVPFIVSV • Example • If large, p ≈ f and only the observed data defines the motif • If small, p ≈ g and the pseudo counts (or prior) defines the motif • is [50-200] normally
Sequence weighting and pseudo counts ALAKAAAAM ALAKAAAAN ALAKAAAAR ALAKAAAAT ALAKAAAAV GMNERPILT GILGFVFTM TLNAWVKVV KLNEPVLLL AVVPFIVSV
Position specific weighting • We know that positions 2 and 9 are anchor positions for most MHC binding motifs • Increase weight on high information positions • Motif found on large data set
Weight matrices • Estimate amino acid frequencies from alignment including sequence weighting and pseudo count • What do the numbers mean? • P2(V)>P2(M). Does this mean that V enables binding more than M. • In nature not all amino acids are found equally often • In nature V is found more often than M, so we must somehow rescale with the background • qM = 0.025, qV = 0.073 • Finding 7% V is hence not significant, but 7% M highly significant A R N D C Q E G H I L K M F P S T W Y V 1 0.08 0.06 0.02 0.03 0.02 0.02 0.03 0.08 0.02 0.08 0.11 0.06 0.04 0.06 0.02 0.09 0.04 0.01 0.04 0.08 2 0.04 0.01 0.01 0.01 0.01 0.01 0.02 0.02 0.01 0.11 0.44 0.02 0.06 0.03 0.01 0.02 0.05 0.00 0.01 0.10 3 0.08 0.04 0.05 0.07 0.02 0.03 0.03 0.08 0.02 0.05 0.11 0.03 0.03 0.06 0.04 0.06 0.05 0.03 0.05 0.07 4 0.08 0.05 0.03 0.10 0.01 0.05 0.08 0.13 0.01 0.05 0.06 0.05 0.01 0.03 0.08 0.06 0.04 0.02 0.01 0.05 5 0.06 0.04 0.05 0.03 0.01 0.04 0.05 0.11 0.03 0.04 0.09 0.04 0.02 0.06 0.06 0.04 0.05 0.02 0.05 0.08 6 0.06 0.03 0.03 0.03 0.03 0.03 0.04 0.06 0.02 0.10 0.14 0.04 0.03 0.05 0.04 0.06 0.06 0.01 0.03 0.13 7 0.10 0.02 0.04 0.04 0.02 0.03 0.04 0.05 0.04 0.08 0.12 0.02 0.03 0.06 0.07 0.06 0.05 0.03 0.03 0.08 8 0.05 0.07 0.04 0.03 0.01 0.04 0.06 0.06 0.03 0.06 0.13 0.06 0.02 0.05 0.04 0.08 0.07 0.01 0.04 0.05 9 0.08 0.02 0.01 0.01 0.02 0.02 0.03 0.02 0.01 0.10 0.23 0.03 0.02 0.04 0.01 0.04 0.04 0.00 0.02 0.25
Weight matrices • A weight matrix is given as Wij = log(pij/qj) • where i is a position in the motif, and j an amino acid. qj is the background frequency for amino acid j. • W is a L x 20 matrix, L is motif length A R N D C Q E G H I L K M F P S T W Y V 1 0.6 0.4 -3.5 -2.4 -0.4 -1.9 -2.7 0.3 -1.1 1.0 0.3 0.0 1.4 1.2 -2.7 1.4 -1.2 -2.0 1.1 0.7 2 -1.6 -6.6 -6.5 -5.4 -2.5 -4.0 -4.7 -3.7 -6.3 1.0 5.1 -3.7 3.1 -4.2 -4.3 -4.2 -0.2 -5.9 -3.8 0.4 3 0.2 -1.3 0.1 1.5 0.0 -1.8 -3.3 0.4 0.5 -1.0 0.3 -2.5 1.2 1.0 -0.1 -0.3 -0.5 3.4 1.6 0.0 4 -0.1 -0.1 -2.0 2.0 -1.6 0.5 0.8 2.0 -3.3 0.1 -1.7 -1.0 -2.2 -1.6 1.7 -0.6 -0.2 1.3 -6.8 -0.7 5 -1.6 -0.1 0.1 -2.2 -1.2 0.4 -0.5 1.9 1.2 -2.2 -0.5 -1.3 -2.2 1.7 1.2 -2.5 -0.1 1.7 1.5 1.0 6 -0.7 -1.4 -1.0 -2.3 1.1 -1.3 -1.4 -0.2 -1.0 1.8 0.8 -1.9 0.2 1.0 -0.4 -0.6 0.4 -0.5 -0.0 2.1 7 1.1 -3.8 -0.2 -1.3 1.3 -0.3 -1.3 -1.4 2.1 0.6 0.7 -5.0 1.1 0.9 1.3 -0.5 -0.9 2.9 -0.4 0.5 8 -2.2 1.0 -0.8 -2.9 -1.4 0.4 0.1 -0.4 0.2 -0.0 1.1 -0.5 -0.5 0.7 -0.3 0.8 0.8 -0.7 1.3 -1.1 9 -0.2 -3.5 -6.1 -4.5 0.7 -0.8 -2.5 -4.0 -2.6 0.9 2.8 -3.0 -1.8 -1.4 -6.2 -1.9 -1.6 -4.9 -1.6 4.5
Scoring a sequence to a weight matrix • Score sequences to weight matrix by looking up and adding L values from the matrix A R N D C Q E G H I L K M F P S T W Y V 1 0.6 0.4 -3.5 -2.4 -0.4 -1.9 -2.7 0.3 -1.1 1.0 0.3 0.0 1.4 1.2 -2.7 1.4 -1.2 -2.0 1.1 0.7 2 -1.6 -6.6 -6.5 -5.4 -2.5 -4.0 -4.7 -3.7 -6.3 1.0 5.1 -3.7 3.1 -4.2 -4.3 -4.2 -0.2 -5.9 -3.8 0.4 3 0.2 -1.3 0.1 1.5 0.0 -1.8 -3.3 0.4 0.5 -1.0 0.3 -2.5 1.2 1.0 -0.1 -0.3 -0.5 3.4 1.6 0.0 4 -0.1 -0.1 -2.0 2.0 -1.6 0.5 0.8 2.0 -3.3 0.1 -1.7 -1.0 -2.2 -1.6 1.7 -0.6 -0.2 1.3 -6.8 -0.7 5 -1.6 -0.1 0.1 -2.2 -1.2 0.4 -0.5 1.9 1.2 -2.2 -0.5 -1.3 -2.2 1.7 1.2 -2.5 -0.1 1.7 1.5 1.0 6 -0.7 -1.4 -1.0 -2.3 1.1 -1.3 -1.4 -0.2 -1.0 1.8 0.8 -1.9 0.2 1.0 -0.4 -0.6 0.4 -0.5 -0.0 2.1 7 1.1 -3.8 -0.2 -1.3 1.3 -0.3 -1.3 -1.4 2.1 0.6 0.7 -5.0 1.1 0.9 1.3 -0.5 -0.9 2.9 -0.4 0.5 8 -2.2 1.0 -0.8 -2.9 -1.4 0.4 0.1 -0.4 0.2 -0.0 1.1 -0.5 -0.5 0.7 -0.3 0.8 0.8 -0.7 1.3 -1.1 9 -0.2 -3.5 -6.1 -4.5 0.7 -0.8 -2.5 -4.0 -2.6 0.9 2.8 -3.0 -1.8 -1.4 -6.2 -1.9 -1.6 -4.9 -1.6 4.5 Which peptide is most likely to bind? Which peptide second? 84nM 23nM 309nM 11.9 14.7 4.3 RLLDDTPEV GLLGNVSTV ALAKAAAAL
Prediction accuracy Pearson correlation 0.45 Measured affinity Prediction score
Why we do bioinformatics: Data driven vs. ab initio methods Limitations of Ab initio predictions of peptide binding to MHC class II molecules. Zhang H, Wang P, Papangelopoulos N, Xu Y, Sette A, Bourne PE, Lund O, Ponomarenko J, Nielsen M, Peters B. PLoS One. 2010 Feb 17;5(2):e9272.
The Bio in Bioinformatics • Data driven computer science methods (NNs, HMMs, Gibbs samplers etc.) have poor performance on protein datasets • To give good performance they must • Be combined with information on amino acid similarities (Dayhoff and followers) • Take data set size (not enough), and composition (to similar) into account
Good performance can be obtained from few data points Lundegaard C, Nielsen M, Lamberth K, Worning P, Sylvester-Hvid C, Buus S, Brunak S, Lund O. 2004. MHC Class I Epitope Binding Prediction Trained on Small Data Sets. In ICARIS 2004. (eds. G. Nicosia, V. Cutello, P.J. Bentley, and J.I. Timmis), Catania, Sicily.
G F C A Lauemøller et al., 2000
Peptide Amino acids of HLA pockets HLA Aff VVLQQHSIA YFAVLTWYGEKVHTHVDTLVRYHY A0201 0.131751 SQVSFQQPL YFAVLTWYGEKVHTHVDTLVRYHY A0201 0.487500 SQCQAIHNV YFAVLTWYGEKVHTHVDTLVRYHY A0201 0.364186 LQQSTYQLV YFAVLTWYGEKVHTHVDTLVRYHY A0201 0.582749 LQPFLQPQL YFAVLTWYGEKVHTHVDTLVRYHY A0201 0.206700 VLAGLLGNV YFAVLTWYGEKVHTHVDTLVRYHY A0201 0.727865 VLAGLLGNV YFAVWTWYGEKVHTHVDTLLRYHY A0202 0.706274 VLAGLLGNV YFAEWTWYGEKVHTHVDTLVRYHY A0203 1.000000 VLAGLLGNV YYAVLTWYGEKVHTHVDTLVRYHY A0206 0.682619 VLAGLLGNV YYAVWTWYRNNVQTDVDTLIRYHY A6802 0.407855 Example