Energy Allocation and Optimal Foraging Theory in Forest Canopies and Understory Plants
This discussion explores the concept of energy limitation in organisms, emphasizing how plants and animals, such as bluegills, allocate their energy resources for survival. By analyzing various figures from Molles (2006), we delve into photosynthetic rates, light intensity, and the impact of prey density on food intake. We highlight optimal foraging theory, revealing how energy supply constraints force organisms to make compromises in energy allocation, influencing both diet choice and survival strategies in competitive environments.

Energy Allocation and Optimal Foraging Theory in Forest Canopies and Understory Plants
E N D
Presentation Transcript
Photosynthetic Rate Light Intensity
Forest Canopy Plants Forest Understory Plants Fig. 6.20 in Molles 2006
Functional Response Fig. 6.21 in Molles 2006
Food Intake Prey Density
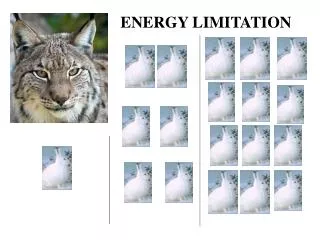
Water Bug vs. Isopod Mayfly Larva
How do Organisms Allocate Energy? 6 5 8 9 7
Optimal Foraging Theory (Derived from Economics) • Energy Supplies are Limited • Organisms cannot maximize all functions • Allocation of Energy is a Compromise between Needs
MODEL FOR ENERGY YIELD: ONE PREY ITEM Ne1E1 - Cs E = __________________ T 1 + Ne1H1
Ne1 = E T = Cs = H1 =
TWO PREY ITEMS + (Ne2E2 – Cs) (Ne1E1 – Cs) E = _____________________________________________ T 1 + Ne1H1 + Ne2H2
DIET CHOICE Ne1E1 - Cs E T = __________________ ONE PREY ITEM 1 + Ne1H1 OR + (Ne2E2 – Cs) (Ne1E1 – Cs) E T TWO PREY ITEMS = _____________________________________________ 1 + Ne1H1 + Ne2H2
Actual Food Availability in the Environment Prey Length (mm)
Bluegill Optimal Diet (Prediction from Theory) Prey Length (mm)
Bluegill Actual Diet Prey Length (mm)
Indian Grass [Next: Chapter 9: Population Distribution and Abundance ]
Chapter 9: Population Distribution • and Abundance • For Tuesday: Read pp. 211-220 • Thursday: Quiz (Chapter 6)
1 http://www.coffeecreekwc.org/photos/birds/Red-Winged_Blackbird_(male).jpg 2 http://www.frw.ca/albums/Ponds-and-Wetlands/Projects_Ponds_and_wetlands_ Red_wing_blackbird_nest_in_c.jpg 3 http://www.migrationresearch.org/mbo/id/rwbl/id%20rwbl%20ahy%20f% 20566%20wing%20jul06.jpg 4 http://www.mikephoto.com/content/binary/blackbird-mobbing.jpg 5 http://www.desertusa.com/july96/IMG_0529.jpg 6 http://www.scienceaid.co.uk/biology/ecology/images/cactus.jpg 7 http://www1.istockphoto.com/file_thumbview_approve/3606144/2/istockphoto_ 3606144_saquaro_cactus_skeleton.jpg 8 http://www.azcentral.com/help/reprints/pics/animal_1.jpg