Download
1 / 1
10 likes | 148 Views
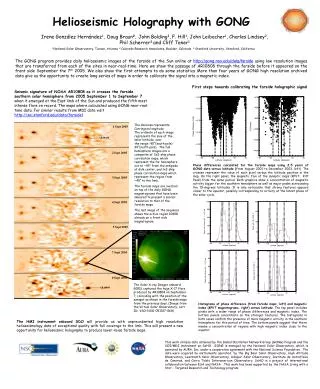
1 Sept 2005. AR10808. AR10808. 2 Sept 2005. 3 Sept 2005. 4 Sept 2005. 5 Sept 2005. 7 Sept 2005. 8 Sept 2005. Helioseismic Holography with GONG.

E N D
1 Sept 2005 AR10808 AR10808 2 Sept 2005 3 Sept 2005 4 Sept 2005 5 Sept 2005 7 Sept 2005 8 Sept 2005 Helioseismic Holography with GONG Irene González Hernández1, Doug Braun2, John Bolding1,F. Hill1, John Leibacher1, Charles Lindsey2, Phil Scherrer3 and Cliff Toner1 1 National Solar Observatory, Tucson, Arizona2 Colorado Research Associates, Boulder, Colorado 3 Stanford University, Stanford, California The GONG program provides daily helioseismic images of the farside of the Sun online at http://gong.nso.edu/data/farside using low resolution images that are transferred from each of the sites in near-real-time. Here we show the passage of AR10808 through the farside before it appeared on the front side September the 7th 2005. We also show the first attempts to do some statistics. More than four years of GONG high resolution archived data give us the opportunity to create long series of maps in order to calibrate the signal into a magnetic index. First steps towards calibrating the farside holographic signal Seismic signature of NOAA AR10808 as it crosses the farside southern solar hemisphere from 2005 September 1 to September 7 when it emerged at the East limb of the Sun and produced the fifth most intense flare on record. The maps where calculated using GONG near-real-time data. For similar results from MDI data visit http://soi.stanford.edu/data/farside) The abscissa represents Carrington longitude. The ordinate of each image represents the sine of the solar latitude, over the range -90°(south pole)-90°(north pole). The full hemisphere images are a composite of 2x2-skip phase correlation maps, which represent the far hemisphere out to ~45° from the antipode of disk center, and 1x3-skip phase correlation maps which represent the region from ~45°to the limb. The farside maps are overlaid on top of the daily GONG magnetograms that have been smeared to present a similar resolution to that of the farside maps. The last image of the sequence shows the active region 10808 already on a front side magnetogram. Phase differences calculated for the farside maps using 2.5 years of GONG data versus latitude (from August 2001 to December 2003, left). The crosses represent the value of each pixel versus the latitude position in the map. On the right panel, the magnetic flux of the synoptic maps (KPVT, Kitt Peak) from the same period. Both graphics show a concentration of magnetic activity bigger for the southern hemisphere as well as major peaks surrounding the 15-degrees latitudes. It is also noticeable that strong features appears closer to the equator, possibly corresponding to activity at the latest phase of the solar cycle. The Solar X-ray Imager onboard GOES captured the huge X-17 flare produced by AR10808 on September 7, coinciding with the position of the sunspot as shown in the farside maps from the previous days. (Image from the Virtual Solar Observatory; cart ID: VSO-NSO-051017-068) Histograms of phase difference (from farside maps, left) and magnetic index (KPVT magnetograms, right) versus latitude. The top panel includes pixels with a wider range of phase differences and magnetic index. The bottom panels concentrate on the stronger features. The histograms in both cases confirm the presence of more magnetic activity in the southern hemisphere for this period of time. The bottom panels suggest that there maybe a concentration of regions with high magnetic index close to the equator. The HMI instrument onboard SDO will provide us with unprecedented high resolution helioseismology data of exceptional quality with full coverage to the limb. This will present a new opportunity for helioseismic holography to produce lower-noise farside maps. This work utilizes data obtained by the Global Oscillation Network Group (GONG) Program and the SOI/MDI instrument on SoHO. GONG is managed by the National Solar Observatory, which is operated by AURA, Inc. under a cooperative agreement with the National Science Foundation. The data were acquired by instruments operated by the Big Bear Solar Observatory, High Altitude Observatory, Learmonth Solar Observatory, Udaipur Solar Observatory, Instituto de Astrofísica de Canarias, and Cerro Tololo Interamerican Observatory. SoHO is a project of international collaboration between ESA and NASA. This work has been supported by the NASA Living with a Star – Targeted Research and Technology program.