Download
1 / 18
180 likes | 489 Views
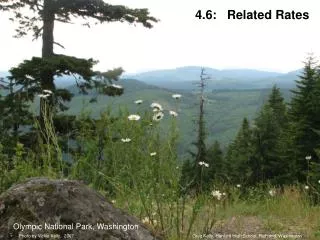
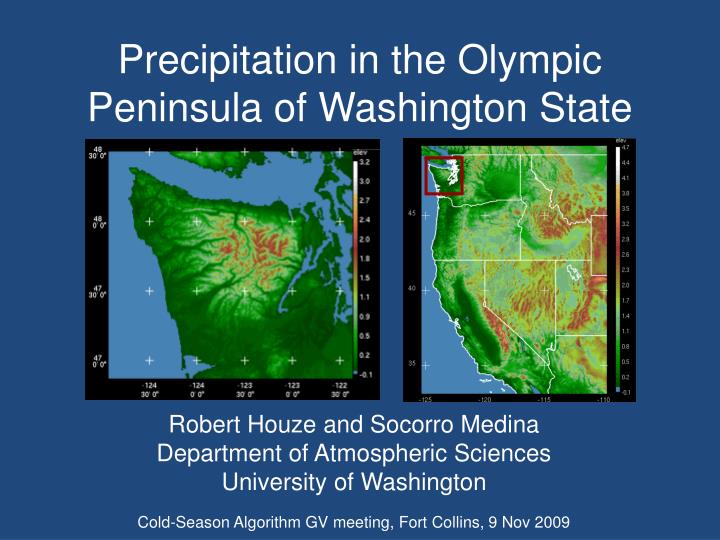
Precipitation in the Olympic Peninsula of Washington State. Robert Houze and Socorro Medina Department of Atmospheric Sciences University of Washington. Cold-Season Algorithm GV meeting, Fort Collins, 9 Nov 2009. The Olympic Peninsula is a natural “precipitation laboratory” .

E N D
Precipitation in the Olympic Peninsula of Washington State Robert Houze and Socorro Medina Department of Atmospheric Sciences University of Washington Cold-Season Algorithm GV meeting, Fort Collins, 9 Nov 2009
The Olympic Peninsula is a natural “precipitation laboratory” • Persistent southwesterly flow during the winter provides a reliable source of moisture • Extremely large precipitation accumulation produced as the moist SWly flow impinges on coastal terrain • Low 0ºC level rain at low elevations, snow at higher levels
The Olympic Peninsula is a natural “precipitation laboratory” • Persistent southwesterly flow during the winter provides a reliable source of moisture NCEP long-term mean sea level pressure (mb) for winter (December to January) and topography
Maximum The Olympic Peninsula is a natural “precipitation laboratory” • Extremely large precipitation accumulation produced as the moist SWly flow impinges on coastal terrain Annual average precipitation (PRISM)
Frequency of occurrence 0°C level The Olympic Peninsula is a natural “precipitation laboratory” • Low 0ºC level rain at low elevations, snow at higher ones Distribution of Nov-Jan 0°C level for flow that is onshore and moist at low levels (KUIL sounding)Mean 0°C level during storms = 1.5 kmSee this full range in individual storms! Plot provided by Justin Minder
Resources and experience in the region • 1965-2000: Cascade Project, CYCLES, COAST • 2001: IMPROVE field experiment • 2004-2008: Detailed observing network across a southwestern Olympics ridge • 2009: NOAA Mobile Atmospheric River Monitoring System in Westport • 2012: NWS Coastal radar expected to be in place • Ongoing: Regional Environmental Prediction
Resources and experience in the region • 2001: IMPROVE field experiment (Stoelinga et al. 2003) Coastline
Detailed gauge network SNOTEL RAWS sites COOP site Anemometers Disdrometers Resources and experience in the region • 2004-2008: Detailed observing network across a southwestern Olympics ridge (Minder et al. 2008)
Resources and experience in the region • 2009: NOAA Mobile Atmospheric River Monitoring System in Westport Data from vertically-pointing S-band radar Signal-to- noise ratio Height Radial velocity Height Time
Resources and experience in the region • 2012: NWS Coastal radar expected to be in place Example of Olympic Mountain slopes views from coastal radar Dark gray areas indicate regions where the 0.5° elevation scans are blocked Current radar coverage Radar coverage with coastal radar
Resources and experience in the region • Ongoing: Regional Environmental Prediction-- WRF, hydrology, air quality, etc (Mass et al. 2003) Real-time mesoscale numerical simulations dx = 36 km dx = 4 km
Resources and experience in the region • Ongoing: Regional Environmental Prediction-- WRF, hydrology, air quality, etc (Mass et al. 2003) Real-time simulations with 1.33 km spatial resolutionwill be available shortly!
Resources and experience in the region • Ongoing: Regional Environmental Prediction-- WRF, hydrology, air quality, etc (Mass et al. 2003) Long period of continuous mesoscale simulations provides model climatology e.g., 5-yr MM5 Nov-Jan precipitation climatology (mm) Verified by gauges: Minder et al. 2008
Resources and experience in the region • Ongoing: Regional Environmental Prediction-- WRF, hydrology, air quality, etc (Mass et al. 2003) Ensemble forecasting probabilistic information e.g., probability that the precipitation accumulated in a 3 h period > 0.1in
Resources and experience in the region • Ongoing: Regional Environmental Prediction-- WRF, hydrology, air quality, etc (Mass et al. 2003) Hydrological prediction: Mesoscale numerical output drives a distributed hydrological model basin streamflow forecast
Coastal Radar Possible field experiment configuration NPOL would have an unimpeded view of the Quinault valley and the Olympic mountains
Conclusions • The Olympic Peninsula is an ideal natural precipitation laboratory given: • Persistence of moist flow, complex terrain, huge precipitation amounts, and low 0°C level • The existing and planned resources and the past experience in this region provide a strong framework for a field campaign
Acknowledgment This research was supported by NASA grant NNX07AD59G and NSF grant ATM-08205586