Download
1 / 14
140 likes | 307 Views
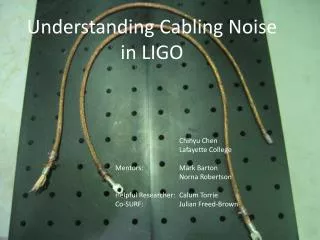
Understanding Cabling Noise in LIGO. Chihyu Chen Lafayette College Mentors: Mark Barton Norna Robertson Helpful Researcher : Calum Torrie Co-SURF: Julian Freed-Brown. E.g. Cabling on OMC Suspension. Cabling connecting the OMC bench to the cage.

E N D
Understanding Cabling Noise in LIGO Chihyu Chen Lafayette College Mentors: Mark Barton Norna Robertson Helpful Researcher:CalumTorrie Co-SURF: Julian Freed-Brown
E.g. Cabling on OMC Suspension Cabling connecting the OMC bench to the cage OMC double pendulum suspension
Pendulum as a vibration isolator ? How would the cabling deteriorate the isolation? Single pendulum resonant at 1 Hz
For structural damping For velocity damping
Method Experimental characterization of the cabling’s damping function. -Jimmy Chen Computer modeling to apply the damping function to specific cabling-attached-to-suspension systems. -Julian Freed-Brown
Apparatus • Two wire torsion pendulum • Support structure for the pendulum • Cabling Apparatus Design Goals • 1. An order of magnitude variability in yaw and pitch frequency • 2. Cases that can be easily modeled • 3. Stiff support structure
Varying pitch frequency Varying yaw frequency Yaw frequency range: 0.14 Hz – 1.27 Hz Pitch frequency range: 0.41 Hz - 2.97Hz
Clamps ensure straight connection pts. Optics table helps stiffen the support structure
Data Collecting • Equipment used: • Kaman eddy current displacement sensor • LabVIEW data logging system
Data Analysis Data analysis method and computer program by Mark Barton
Yaw mode Pitch mode Results Model predictions by Julian Freed-Brown, based on equations by CalumTorrie.
Results Future Work Feed results into Julian’s Mathematica model Check for agreement between the model and experiment frequency results. Study the resulting transfer functions and make recommendations on cabling dressing.