Download

1 / 9
0 likes | 1 Views
Discover why data visualization is essential for smarter business decisions. Learn how visualization software, consultants, and tools turn data into insights.<br><br>For More Information Visit : https://medium.com/@augmentedsystems90/why-data-visualization-is-the-key-to-smarter-business-decisions-8d6c08b90290

E N D
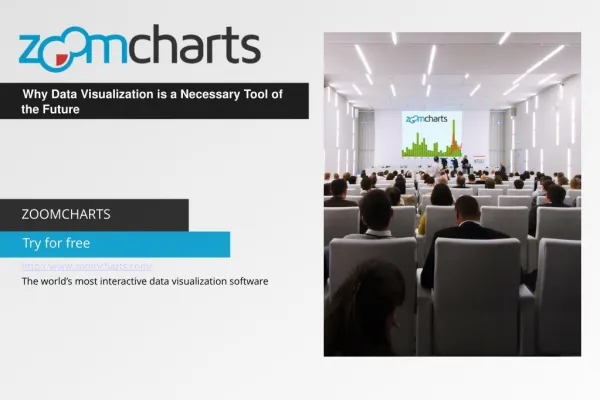
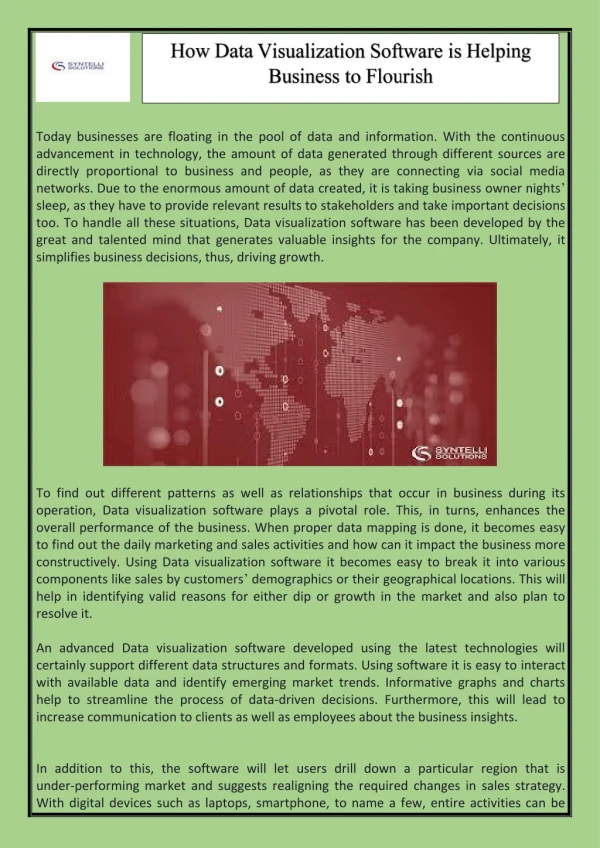
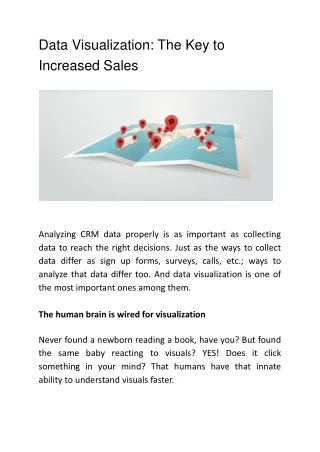
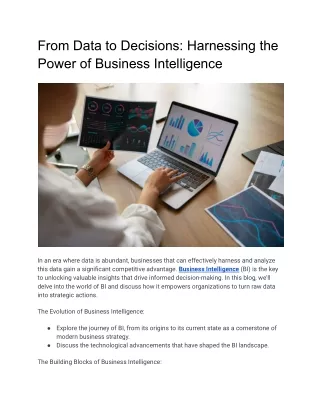
Why Data Visualization Is the Key to Smarter Business Decisions Businesses today are drowning in data — but data alone doesn't tell a story. What makes data powerful is how it's visualized, interpreted, and acted upon.
FOUNDATION What Is Data Visualization? Data visualization transforms numbers and raw data into visual stories using charts, graphs, dashboards, and infographics. Instead of reading endless spreadsheets, visualization helps you see patterns, trends, and relationships instantly — translating data into a language everyone can understand.
Why Visualization Matters in Business Real-Time Clarity Fast Decision-Making Simplified Complexity Track user engagement, system performance, and market changes instantly with visual dashboards. Complex datasets become understandable at a glance, enabling confident strategic choices. Leaders respond to customer trends and operational issues quickly with actionable insights.
Key Benefits of Data Visualization These benefits make visualization tools indispensable in any organization's tech stack. Businesses that visualize data effectively are five times more likely to make faster, better decisions. Clarity Complex data becomes easy to understand Speed Insights drawn in seconds instead of hours Accuracy Visuals highlight errors or outliers text reports miss Engagement Visual content keeps stakeholders interested Decision Support Helps predict outcomes and assess risk
Real-World Success Stories Amazon Netflix Google Optimizes logistics and forecasts inventory needs using visual dashboards Analyzes viewer behavior to recommend content through visualization tools Tracks web traffic, ad performance, and AI model metrics with advanced visuals Top companies use data visualization daily to stay ahead of the curve — and smaller firms can do the same with the right tools.
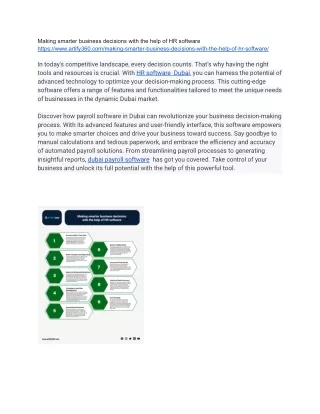
EXPERT ROLES The Power of Visualization Experts Augmented Systems Strategic Guidance Stands out as a leader in building custom dashboards, real-time monitoring tools, and AI-powered reports tailored to business objectives. Consultant: Strategy & Tool Selection Specialist: Dashboard Development Enablement & Adoption Hands-on Execution Their experts ensure your decisions are always backed by clear data visuals. Specialist: Reporting & Integration Consultant: Training & Stakeholder Coaching Tactical Delivery Consultants bridge raw data and decision-makers, ensuring visuals tell the right story. Specialists combine artistic design with analytical thinking for beautiful, meaningful outputs.
Choosing the Right Software 1 2 3 4 Ease of Use Integration Scalability Customization Can your team learn it quickly? Does it work with your existing tools? Can it handle growing data volumes? Can you design dashboards your way? Common Mistakes to Avoid • Too much information overloads visuals and confuses viewers • Poor color choices mislead interpretations • Lack of context creates confusion without labels or scales • Ignoring the audience — tailor visuals for decision-makers
The Future: AI-Powered Visualization 01 02 Automatic Trend Identification Smart Recommendations AI tools identify patterns without manual analysis Systems predict customer churn and highlight revenue dips automatically 03 Build Data-Driven Culture Train teams, foster collaboration, and make data visualization a mindset Information is power — but only if you can see it clearly. Visualization turns data into a competitive advantage that shapes the future.
For More Information contact us : https://www.augmentedtechlabs.com/ (979)344-6508 info@augmentedtechlabs.com