Download
1 / 2
20 likes | 42 Views
If you are looking for data visualization tool with various big data analytics solutions then Syntelli Solution is one of the best option for you.

E N D
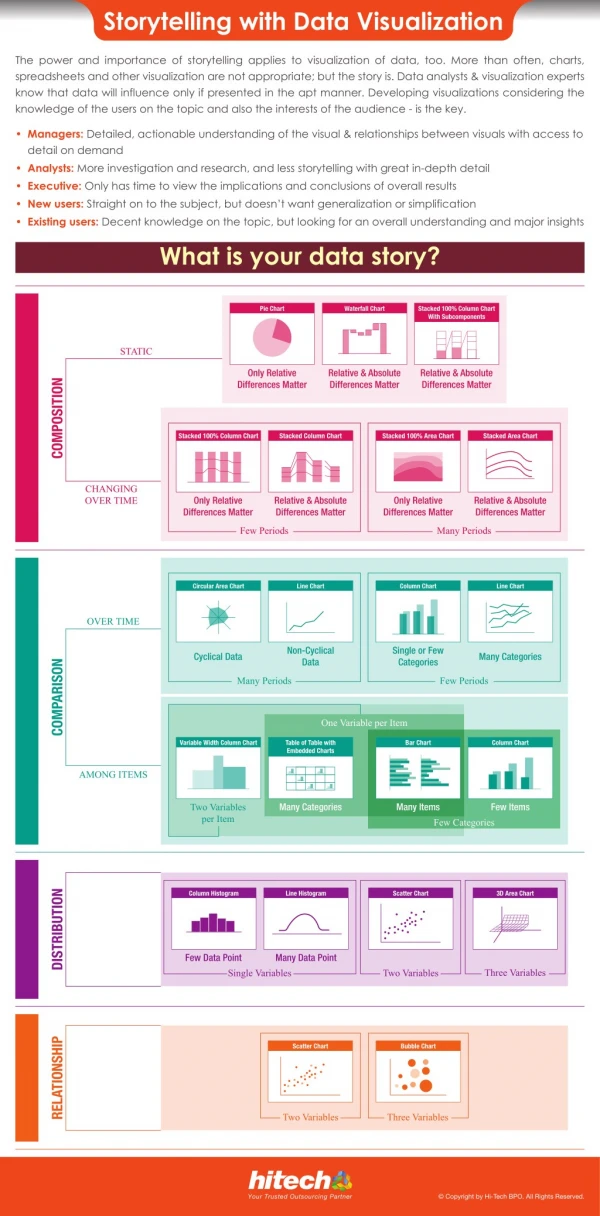
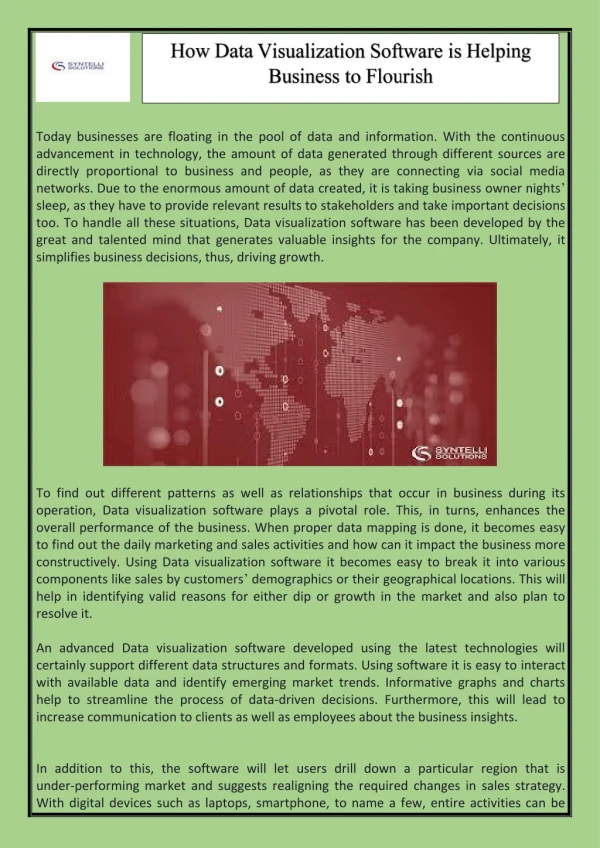
Today businesses are floating in the pool of data and information. With the continuous advancement in technology, the amount of data generated through different sources are directly proportional to business and people, as they are connecting via social media networks. Due to the enormous amount of data created, it is taking business owner nights’ sleep, as they have to provide relevant results to stakeholders and take important decisions too. To handle all these situations, Data visualization software has been developed by the great and talented mind that generates valuable insights for the company. Ultimately, it simplifies business decisions, thus, driving growth. To find out different patterns as well as relationships that occur in business during its operation, Data visualization software plays a pivotal role. This, in turns, enhances the overall performance of the business. When proper data mapping is done, it becomes easy to find out the daily marketing and sales activities and how can it impact the business more constructively. Using Data visualization software it becomes easy to break it into various components like sales by customers’ demographics or their geographical locations. This will help in identifying valid reasons for either dip or growth in the market and also plan to resolve it. An advanced Data visualization software developed using the latest technologies will certainly support different data structures and formats. Using software it is easy to interact with available data and identify emerging market trends. Informative graphs and charts help to streamline the process of data-driven decisions. Furthermore, this will lead to increase communication to clients as well as employees about the business insights. In addition to this, the software will let users drill down a particular region that is under-performing market and suggests realigning the required changes in sales strategy. With digital devices such as laptops, smartphone, to name a few, entire activities can be
tracked, monitored and worked upon while on move. For this, one need not have to stay in the office. Such is the blessing of technology today that has simplified the life of businesses as well as individuals. Thus, Data visualization software is a vital tool that helps in noticing different patterns across department, geographical and demo-graphical locations. The software analyses real-time data visualization that empowers business. It gives needed information to businesses that can turn actionable insights into action. If you are looking for data visualization tool with various big data analytics solutions then Syntelli Solution is one of the best option for you. To Know More About Syntelli Solution please Visit: https://www.syntelli.com OUR OFFICE 13925 Ballantyne Corporate Pl #260 Charlotte, NC 28277, USA CONTACT US +1-(877)-796-8355 info@syntelli.com