Download
1 / 5
50 likes | 200 Views
Aim: How to plot or graph data Dow Now: What are the steps to the Scientific Method. Homework: On separate sheet of paper of data from the back page of the worksheet. In a sentence explain the relationship between volume and pressure. (is it a direct or Indirect Relationship? Why?).

E N D
Aim: How to plot or graph dataDow Now: What are the steps to the Scientific Method. Homework: On separate sheet of paper of data from the back page of the worksheet. In a sentence explain the relationship between volume and pressure. (is it a direct or Indirect Relationship? Why?)
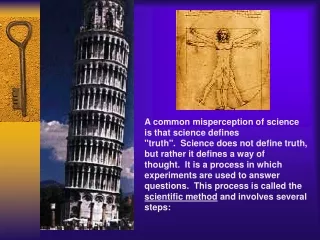
What is the Scientific Method? • “The Road to Knowledge” • The Scientific Method is a method of procedure scientist use consisting in observation, measurement, and experiment, and the formulation, testing, and modification of hypotheses. • It is a way to ask and answer scientific questions by making observations and doing experiments • It is a dynamic process; meaning, there is no definite order to the steps in the scientific method. Scientist jump from one step to another when testing a hypothesis, even formulating a new one.
Steps to the Scientific Method • Making observations • Coming up with a hypothesis and testing it. A hypothesis involves developing an idea or set of ideas that might explain our observations • Collect and analyze data. • Check results in experiment against your hypothesis: “Do your results agree with your hypothesis?” • Start over if you need to.
Graphing and Analyzing Data • Identify dependent and independent variables • Dependent variable – the variable that is being observed during an experiment. • Independent variable – the variable that is being changed during an experiment • Labeling the graph • Title the graph • Label the y-axis (dependent variable) and x-axis (independent variable) • Direct relationship; “as one variable increases, the other variable increases” or “as one variable decreases, the other variable decreases” • Indirect or inverse relationship; “as one variable increases, the other variable decreases” or “as one variable decreases, the other variable increases”