Download
1 / 8
0 likes | 22 Views
<br>"Unlock the potential of data with our comprehensive course on mastering Excel, Power BI, Data Science, and more. From organizing and analyzing data in Excel to creating powerful visualizations in Power BI, this course covers everything you need to become a data expert. Dive into the world of data science and elevate your skills to new heights. Enroll now and start mastering data!"<br><br>Useful Links:-<br>https://www.attitudetallyacademy.com/functionalarea/mis-and-data-analytics<br>https://www.attitudetallyacademy.com/class/pythonda<br>https://maps.app.goo.gl/GsdeBSajnqXdBaAX6<br>https://maps.app.goo.gl/1SRGK

E N D
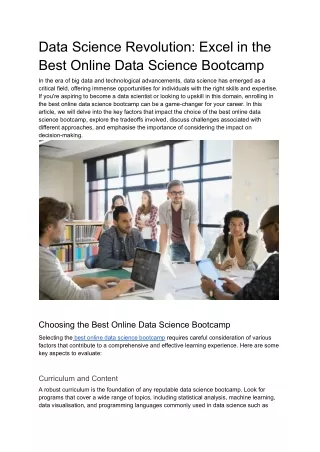
Mastering Data: Excel, Power BI, Data Science, and More This comprehensive guide covers essential data skills to excel in today's data-driven world. From learning Excel formulas and Power BI visualizations to exploring data science fundamentals and predictive analytics, this series will empower you to become a data-driven decision maker. by Vinay Sharma Va
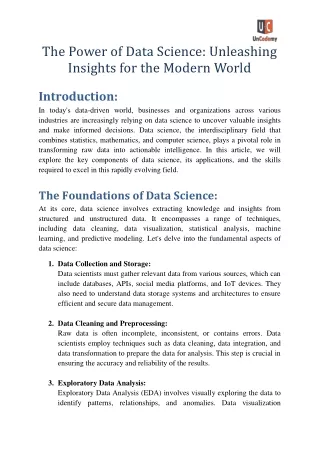
Introduction to Data Analysis Data Gathering Exploratory Analysis Visualization & Reporting Collect and organize data from various sources to uncover insights. Dive into the data to identify patterns, trends, and anomalies. Create compelling visualizations and data-driven reports to communicate findings.
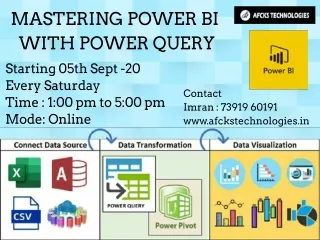
Excel Essentials: Formulas, Functions, and Pivot Tables Formulas Pivot Tables Unlock the power of Excel formulas to perform complex calculations and data manipulations. Gain insights by summarizing and analyzing large datasets with just a few clicks. 1 2 3 Functions Leverage built-in functions to streamline data analysis and enhance productivity.
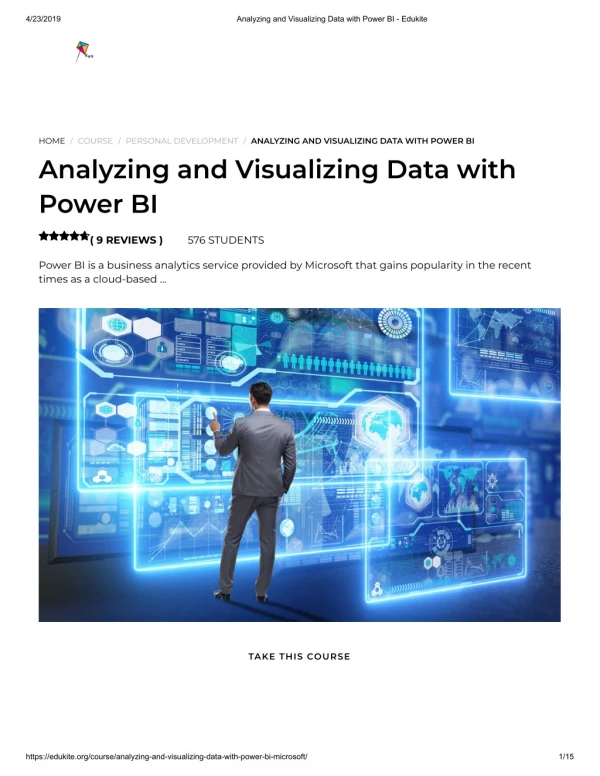
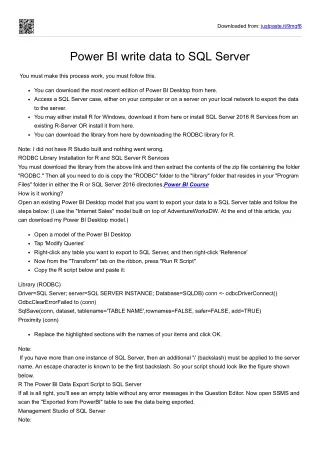
Visualizing Data with Power BI Interactive Dashboards Data Modeling Reporting Create visually stunning and interactive dashboards to tell a compelling data story. Understand how to model your data for efficient and effective analysis. Build comprehensive reports that provide valuable insights and drive data-driven decisions.
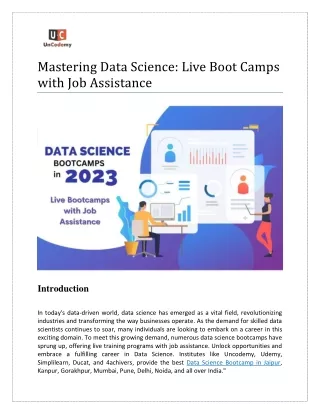
Exploring Data Science Fundamentals Statistical Analysis Machine Learning Leverage statistical techniques to uncover hidden patterns and relationships in data. Discover how algorithms can be used to make predictions and automate decision-making. Data Modeling Programming Develop models to simulate real-world scenarios and test hypotheses. Gain proficiency in programming languages like Python and R to perform data analysis.
Predictive Analytics and Machine Learning Forecasting Anomaly Detection Clustering Classification Leverage machine learning algorithms to make accurate predictions about future trends. Identify outliers and unusual patterns that may signal opportunities or risks. Group similar data points together to uncover hidden segments and personas. Build models to categorize data and make informed decisions.
Storytelling with Data Understand the Audience Tailor your data narrative to the needs and interests of your stakeholders. Craft a Compelling Story Combine data insights with a narrative structure to captivate your audience. Choose Effective Visuals Select the right visualizations to support your story and enhance understanding.
Becoming a Data-Driven Decision Maker Cultivate a Data Mindset Embrace a culture of data-driven decision-making within your organization. Leverage Data Tools Utilize powerful data analysis and visualization tools to derive actionable insights. Communicate Effectively Present data findings in a clear, concise, and impactful manner to stakeholders. Continuously Learn Stay up-to-date with the latest data trends, techniques, and technologies.