Download
1 / 19
190 likes | 382 Views
Abnormal Returns and Volume Effects Associated with Index Reconstitution in CSI 300. Jianye Zhai ,UESTC July 7, 2007. Outline. Ⅰ. Introduction Ⅱ. Literature Review Ⅲ. Data and Methodology Ⅳ. Empirical Analysis Ⅴ. Conclusions. Ⅰ. Introduction.

E N D
Abnormal Returns and Volume Effects Associated with Index Reconstitution in CSI 300 Jianye Zhai ,UESTC July 7, 2007 www.swingtum.com/institute/IWIF
Outline Ⅰ. Introduction Ⅱ. Literature Review Ⅲ. Data and Methodology Ⅳ. Empirical Analysis Ⅴ. Conclusions www.swingtum.com/institute/IWIF
Ⅰ.Introduction In most security markets, stock indices are reviewed and adjusted in a fixed period. Some stocks will be added in indices and some other stocks will be deleted away based on ranks subject to some financial factors, such as market capitalization and average daily traded volume, etc. Non-periodic reconstitutions are taken on occasion due to firms’ bankruptcy, merges, acquisitions and special reasons for frequency IPO in China. www.swingtum.com/institute/IWIF
Ⅰ.Introduction Many empirical studies reveal that prices and trading volumes of included and excluded stocks are significantly affected by index reconstitution. Most of previous literature is conducted through using samples of some famous indices, such as Russell and S&P 500, and seldom testing on reconstitution effects of emerging markets’ indices. Considering China security markets’ leading role among emerging markets,how about index reconstruction in China's stock markets? www.swingtum.com/institute/IWIF
Ⅱ. Literature Review S&P 500 Lynch and Mendenhall (1997) find positive (negative) abnormal returns to additions (deletions) on announcement day, and last to change day; abnormal returns are only partially reversed following the change; volume on the day before change date is highest. Beneish and Whaley (1996) find that there is a permanent increase in price for additions but transitory effects on volumes. www.swingtum.com/institute/IWIF
Ⅱ. Literature Review Russell Additions to Russell 1000 generate cumulative excess returns of 10.9% from 2 days before May 31 to June 30 while stocks deleted from Russell 2000 Growth Index suffer cumulative loss of 6.6% (Hsiu-lang Chen, 2006). DJIA The price and the trading volume of newly listed DJIA firms are unaffected (M D. Beneish and J. Gardner, 1995). www.swingtum.com/institute/IWIF
Ⅱ. Literature Review www.swingtum.com/institute/IWIF
Ⅱ. Literature Review www.swingtum.com/institute/IWIF
Ⅱ. Literature Review The Price Pressure Hypothesis: which holds that transitory order imbalances associated with index additions and deletions are the primary source of price movements. The Index Membership Hypothesis: which holds that index itself is a source of value, possibly because of changes in liquidity or information flows. www.swingtum.com/institute/IWIF
Ⅲ. Data and Methodology 1. Sample: Periodical reconstitutions of CSI 300 index are taken at early of January and July every year. Table 1:List of CSI 300 four periodical reconstitutions www.swingtum.com/institute/IWIF
Ⅲ. Data and Methodology Until March 15, 2007, CSI 300 changed 10 times after it was constructed, including four periodical reconstitutions and six non-periodic reconstitutions. 2. Event-study Methodology First, we calculate abnormal returns (AR), and then we calculate cumulative abnormal returns (CAR) using daily data. www.swingtum.com/institute/IWIF
Ⅲ. Data and Methodology 3. Volume Ratio (VR) , represent trading volume of stock i and CSI 300 on the trading day t, respectively; , refers to average trading volume of stocks and CSI 300 during the period of (AD-40, AD-10), respectively. 4. T-test is used to check whether the null hypotheses of (cumulative) abnormal returns equal to zero and volume ratio equals to one are rejected. www.swingtum.com/institute/IWIF
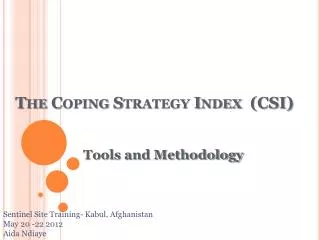
Ⅳ. Empirical Analysis- CAR www.swingtum.com/institute/IWIF
Ⅳ. Empirical Analysis- CAR 1. Both the Price Pressure Hypothesis and the Index Membership Hypothesis suggest that (cumulative) abnormal returns should be positive on the actual change date, while opposite results appear in this paper. We argue that few funds are tracing CSI 300, and few speculators are interested in acquire excess returns from the index reconstitution event, so there is little pressure driving added stocks’ prices to increase on change date. 2. Most abnormal returns are significantly differ from zero statistically during the period (AD-10,CD+10), abnormal returns can be found during CSI 300 reconstitutions. www.swingtum.com/institute/IWIF
Ⅳ. Empirical Analysis- CAR 3. One dramatic discovery is that the signs of added and excluded stocks are accurately same in each group during the full event period (AD-10, CD+10). On the other hand, added stocks’ CAR in different groups are significantly distinctive. Those high volatility abnormal returns imply high risk for speculators if they try to capture abnormal returns during index reconstitution. www.swingtum.com/institute/IWIF
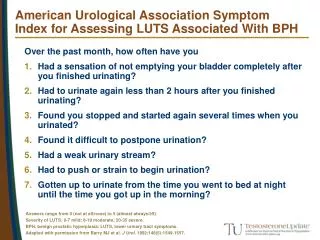
Ⅳ. Empirical Analysis- Volume Ratio www.swingtum.com/institute/IWIF
Ⅳ. Empirical Analysis- Volume Ratio 1. During the trading period (AD-10, CD+10), trading volume is less (more) than in normal situation for additions (deletions). 2. Volume Ratio is heterogeneous for additions and deletions in sub-periods, for instance, it’s 1.655 in group 3 while 0.755 in group 4 for deletions on the actual change date, and both values are statistically significant. It implies high volume volatility and high trade risk meanwhile. www.swingtum.com/institute/IWIF
Ⅴ. Conclusions 1. Abnormal Returns can be found during CSI 300 index reconstitutions. 2. Ours empirical results don’t support the Price Pressure Hypothesis or the Index Membership Hypothesis. 3. Both the analysis of abnormal returns and volume volatility reveal the high risks to capture excess returns from CSI 300 reconstitution. www.swingtum.com/institute/IWIF
Acknowledge: Thanks to my teacher, Professor Fang! I am also grateful to Lei Chen and Wei Fan for their helpful comments! Thanks all ! www.swingtum.com/institute/IWIF