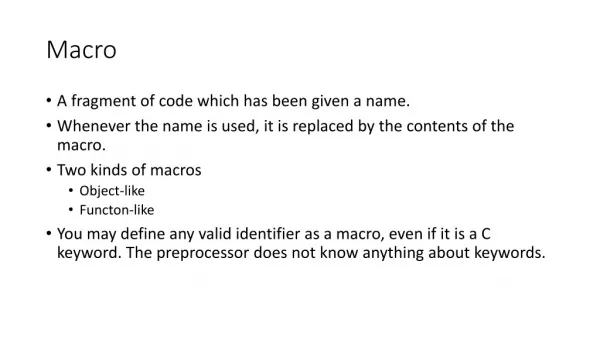
Macro Issues
Macro Issues. Philip C. Zerrillo Ph.D. NU- Day 2. What Will Drive the Performance of a Firm?. Human resources. Attracting, developing, retaining, and dismissing. New products. Those that the market wants, those that allow us to enter market. Cost control.


Macro Issues
E N D
Presentation Transcript
Macro Issues Philip C. Zerrillo Ph.D. NU- Day 2
What Will Drive the Performance of a Firm? • Human resources. • Attracting, developing, retaining, and dismissing. • New products. • Those that the market wants, those that allow us to enter market. • Cost control. • Activity based costing, time-based costing. • Capital management. • Steady capital flow, low cost sources, cash flow management. • Good vision. • A succinct and directed strategy, well articulated and communicated.
The Drivers of Firm Performance Managerial Performance Industry Structure Macro Environmental Factors
Firm Performance cont. • Environmental factors • Economy • Demography • Political/Legal • Social • Physical • Technological
Supply Vs Demand Economy Demand Investment Employment Income Savings Interest Investment Employment Income
Supply v. Demand Supply Demand Fast growth Higher interest rates Inflation Domestic stimulus Export less important • Slow growth • Stable • Low interest rates • Export growth • Domestic dampening
Population AgesAsia 5-25 60+ 5-25 60+ (80) (80) (00) (00) Australia 33.8 14.2 28 16.3 Bangladesh 48.5 4.8 45.5 4.9 India 43.9 6.2 40.8 7.6 Indonesia 44.7 5.2 40.4 7.6 Malaysia 52.0 4.2 41.2 6.6 New Zealand 35.7 14.3 29.2 15.6 Philippines 46.0 4.8 44.8 5.5 Singapore 36.0 7.7 27.4 10.6 Sri Lanka 43.7 6.6 37.3 9.3 Thailand 46.2 5.4 36.2 8.1 Viet Nam NA NA 43.8 7.5
Life Expectancy Life X Life X Life X Life X M(80) F(80) M(00) F(00) Australia 71.9 78.7 76.4 82 Bangladesh 50.1 49.3 60.6 60.8 India 55.3 55.1 63.6 64.9 Indonesia 54.5 58.0 65.3 69.3 Malaysia 66.0 70.0 70.6 75.5 New Zealand 70.7 76.9 75.3 80.7 Philippines 60.2 63.7 68 72 Singapore 69.2 74.6 75.9 80.3 Sri Lanka 67.0 71.5 69.9 75.9 Thailand 62.6 67.4 67.9 73.8 Viet Nam 56.7 61.1 66.9 71.6
Birth RatesPer 1000 1980 2000 Australia 21.0 13.9 Bangladesh 48.1 43 India 36.2 28.7 Indonesia 38.1 24.6 Malaysia 35.2 25.8 New Zealand 22.3 15.3 Philippines 38.4 31.2 Singapore 21.2 12.7 Sri Lanka 24.4 18.6 Thailand 39.1 18.1 Viet Nam 39.3 28.9
LiteracyNA & SA • Mexico (M) 8.2 (F) 7.8 • Argent 3.8 3.8 • Chile 4.6 5.0 • Brazil 16.7 16.8 • Peru 5.5 17
LiteracyAsia • H-Kong (M) 4.0 (F) 11.8 • Japan NA NA • Thail (M) 4.0 (F) 8.4 • Korea (M) .7 (F) 3.3 • Philip (M) 5.0 (F) 5.7
LiteracyEurope • Greece (M) 4.8 (F) 3.2 • Italy (M) 4.8 (F) 2.3 • Spain (M) 2.5 (F) 5.8 • Swe (M) 2.4 (F) 2.3
Why Did The US Economy Slide? • Greenspan? • Exuberance? • Taxes? • Regulation?
Employment (% Agriculture) M(80) F(80) M(00) F(00) Australia 7.2 4.1 6.1 3.6 Bangladesh 62.5 8.5 NA NA India 64.2 57.5 NA NA Indonesia 56.0 52.5 53.0 56.0 Malaysia 31.9 38.1 21.5 16.8 New Zealand 13.2 6.6 NA NA Philippines 55.1 33.9 51.6 31.0 Singapore 2.0 1.1 0.3 0.04 Sri Lanka 37.2 35.7 35.4 41.5 Thailand 69.8 75.6 59.8 60.8 Viet Nam
Employment(% Professional) M(80) F(80) M(00) F(00) Australia 25.4 11.0 11.7 14.4 Bangladesh 2.4 3.1 NA NA India 3.1 2.3 NA NA Indonesia 2.7 3.2 0.7 0.6 Malaysia 5.7 7.0 4.3 5.0 New Zealand 11.8 17.7 NA NA Philippines 3.9 9.8 2.0 2.3 Singapore 7.9 9.3 9.2 13.3 Sri Lanka 3.5 9.1 1.5 2.1 Thailand 5.1 3.2 NA NA Viet Nam
Employment(% Manufacture) M(80) F(80) M(00) F(00) Australia 44.4 10.1 17.8 8.7 Bangladesh 14.6 30.4 NA NA India 16.2 6.8 NA NA Indonesia 20.7 13.1 8.7 12.0 Malaysia 26.8 14.5 20.0 29.4 New Zealand 46.6 17.4 NA NA Philippines 15.8 11.0 8.4 12.7 Singapore 39.8 33.7 26.0 26.1 Sri Lanka 25.4 11.1 11.3 27.0 Thailand 11.8 7.8 10.0 12.2 Vietnam