Bacterial Mutation Analysis
This study aims to determine the mutation rates in plasmids pBR325.CCTG.36 and pBR325.CCTG.58 within E. coli strains MC4100 and Hfq-. Specifically, we focus on mutations characterized by the shortening of CCTG tracts. By performing transformations, we introduce plasmid DNA into bacterial cultures, allowing for DNA purification and selective identification using the CAT gene. We draw on historical models, such as the Luria and Delbrück model, to estimate mutation probabilities and rates. Our research enhances understanding of disease-related CCTG repeats.

Bacterial Mutation Analysis
E N D
Presentation Transcript
What we want to do… • Determine the rate of mutations in plasmids pBR325 CCTG 36 and pBR325 CCTG 58 in strains of E. coli MC4100 and Hfq-. • The mutations are the shrinking in length of a CCTG tract of 36 or 58 repeats.
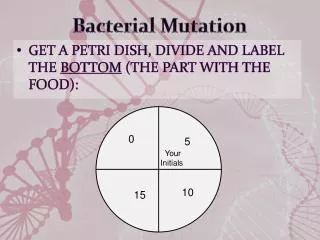
How we are doing it… • Transformations! • Add the DNA containing the plasmids to the strains. Let the cultures grow. Purify DNA from those cultures. Put the new DNA in another type of E. coli that we can selectively pick out to check if it has the plasmid.
The CAT gene in plasmid pBR325 is used for genetic selection . EcoRI 5’CTCATCCGGAATTCCGTATGGCAATG3’ 3’GAGTAGGCCTTAAGGCATACCGTTAC5’
Some Reversion Frequencies! Sample Legend: 1 - MC4100 + pBR325 CCTG 36 4 - Hfq- + pBR325 CCTG 36 7 - MC4100 + pBR325 CCTG 58 10 - Hfq- + pBR325 CCTG 58
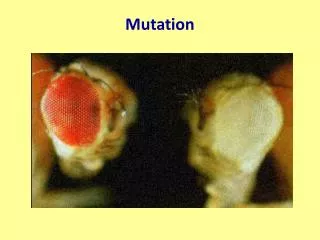
Why we want to do it… • To learn more about the disease-causing CCTG repeat.
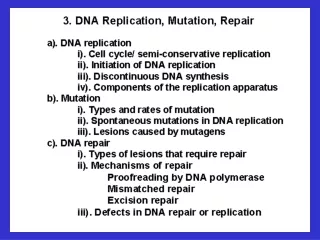
The Foster paper… • Offers us a comparison of the current methods being used to analyze the mutation rates in bacterial populations. • The paper starts with the first model developed, the Luria and Delbrück (1943) model.
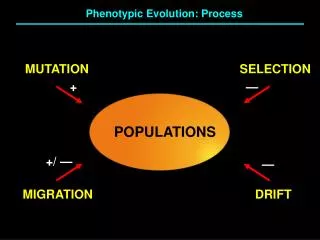
Where we are… • Reading the Luria and Delbrück paper! • Proposes that there is a finite probability for any bacteria to mutate during its lifetime from “sensitive” to “resistant” (mutation hypothesis). • If this is the case, the population of bacteria should increase with time, as this new resistant bacteria multiply.
Where we are… • We have an exponential growth model! where t is units of division cycles of bacteria. • Derives that the number of mutations occurring on a finite interval is given by where a is the mutation rate.
Where we are… • Assumes that the number of mutations is small, hence the distribution is given through Poisson’s law… • If we can determine the fraction of bacteria in which no mutation occurred, this fraction should be
Where we are… • From that we can determine ‘m’, and hence find the mutation rate ‘a’.
What’s next… • Finish working out the Luria and Delbrück paper. • Work out Lea and Coulson who build on Luria and Delbrück by giving us ways to calculate the actual distribution of mutants. • Go from there…