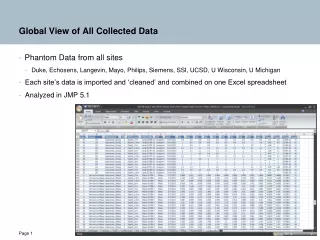
Download
1 / 22
220 likes | 370 Views
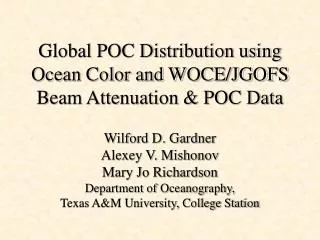
Global POC Synthesis from Beam Attenuation Data collected during JGOFS, WOCE and other programs. A.V. Mishonov, W.D. Gardner, & M.J. Richardson Department of Oceanography Texas A & M University College Station. Background.

E N D
Global POC Synthesis from Beam Attenuation Datacollected during JGOFS, WOCE and other programs A.V. Mishonov, W.D. Gardner, & M.J. Richardson Department of Oceanography Texas A & M University College Station
Background One of the major goals of JGOFS is to develop regional and global mass balances for carbon. Selected areas were studied through shipboard sampling during JGOFS in the last 15 years. To extend global coverage, the marine carbon dioxide survey was integrated with WOCE. SMP meeting, WH-2000
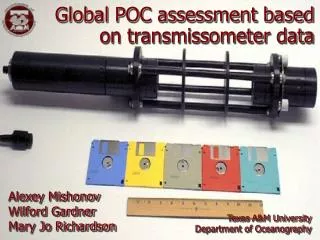
Introduction To obtain information about POC distribution it is possible to use in-situ optical instruments - e.g. transmissometer and convert beam attenuation to POC. In order to extend our data coverage to a global level, we convinced many WOCE scientists to interface our transmissometers on their WOCE cruises during the last decade. We now have an opportunity to reduce & synthesize the data collected. SMP meeting, WH-2000
Objectives • Reduce and quality control the transmissometer data from 17 WOCE cruises, providing accessibility and compatibility with JGOFS data for input to models of carbon cycling, aggregation / disaggregation, etc. • Establish new ocean- or region-specific algorithms to estimate global POC standing stock in the surface ocean from satellite back-scatter data and our transmissometer data sets. • Explore whether the relationship between CO2 drawdown and POC concentration can be used to estimate POC export from surface waters. SMP meeting, WH-2000
Data Set Transmissometer data have been collected using instruments provided by our group over the last decade in collaboration with WOCE, JGOFS, and other large-scale hydrographic programs. These data include basin-wide transects in the North and South Atlantic, North and South Pacific, Indian, and Southern Oceans. We have been funded to analyze these data and convert the beam attenuation values to POC using the Beam Attenuation:POC relationships derived by our group during JGOFS Process studies. SMP meeting, WH-2000
JGOFS WOCE Others Station Coverage: WOCE, JGOFS & others SMP meeting, WH-2000
Available Transmissometer Data: • 19 WOCE cruises (Jan.1990 - Jun.1997), which includes: • 2231/2239 Sts/Casts; • More data will be included from: • JGOFS: 22 cruises, 410/1568 Sts/Casts • SAVE, WBEX, MCTT, etc: 9 cruises, 600 Sts (est.) • Possible future additions: • BATS & HOT: TBA • other archives (BOFS, NIOP, etc.): TBA SMP meeting, WH-2000
Global Transmissometer Data Stations per Year Distribution SMP meeting, WH-2000
Global Transmissometer Data Stations per Month Distribution SMP meeting, WH-2000
WOCE Cruises (19) SMP meeting, WH-2000
WOCE Stations Stations WOCE Lines SMP meeting, WH-2000
JGOFS Cruises (22) SMP meeting, WH-2000
JGOFS Stations Stations JGOFS Cruises SMP meeting, WH-2000
Other Cruises (9) SMP meeting, WH-2000
Other Stations Stations Other Programs SMP meeting, WH-2000
Data Inventory Sample Sections SMP meeting, WH-2000
Pacific Ocean SectionRV Th.Thompson, Jul-Aug. 93, Line p14n North Beam Attenuation Depth, m Distance, nm SMP meeting, WH-2000
0 -1000 -2000 -3000 Depth, m -4000 Beam Attenuation -5000 Distance, nm -6000 0.38 0.4 0.42 0.44 0.46 0.48 0.5 0.52 0.54 0.56 0 500 1000 1500 2000 2500 3000 Indian Ocean Section RV Knorr, Feb. 95, Line i09s SMP meeting, WH-2000
Future steps 1 Transmissometer database: • Process 19 WOCE cruises of transmissometer data; • Add processed transmissometer & POC data from 22 JGOFS cruises; • Add processed transmissometer data from other basin-scale cruises where we have data (9+). SMP meeting, WH-2000
Future steps 2 Beam attenuation / POC relationship: • Use algorithms developed during JGOFS: NABE, Arabian Sea, and Ross Sea/Antarctic Polar Front Zone expeditions; • convert Beam Attenuation to POC & quantify spatial and temporal distribution. SMP meeting, WH-2000
Cp, m-1 RS: y=0.0178x - 0.0155R2=0.874 NABE: y=0.0376x - 0.0032R2=0.913 APFZ: y=0.0264x - 0.0649R2=0.982 POC, mM C/L JGOFS: Beam Cp versus POC SMP meeting, WH-2000
Thank You! SMP meeting, WH-2000