Download
1 / 6
60 likes | 161 Views
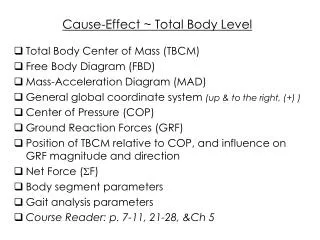
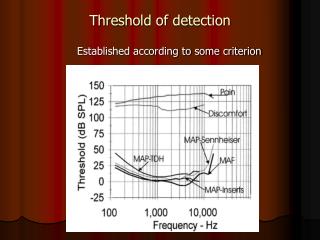
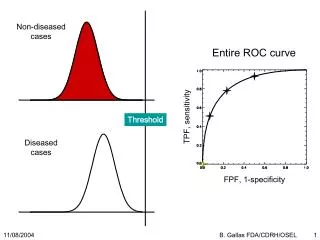
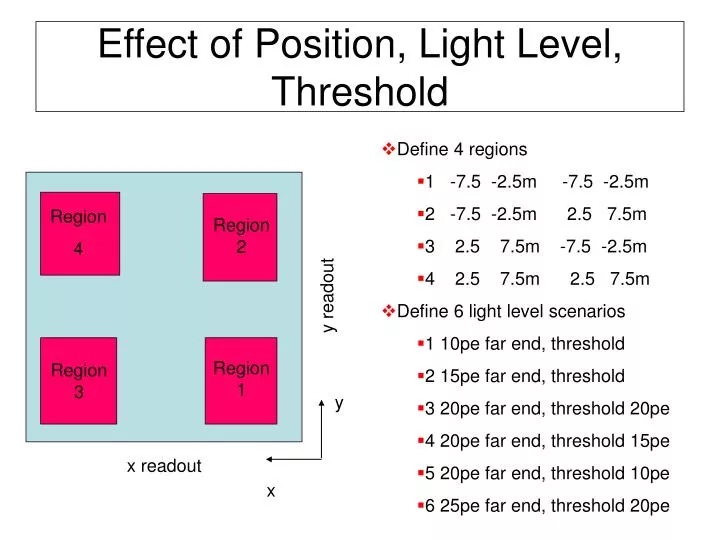
Region 4. Region 2. y readout. Region 1. Region 3. y. x readout. x. Effect of Position, Light Level, Threshold. Define 4 regions 1 -7.5 -2.5m -7.5 -2.5m 2 -7.5 -2.5m 2.5 7.5m 3 2.5 7.5m -7.5 -2.5m 4 2.5 7.5m 2.5 7.5m

E N D
Region 4 Region 2 y readout Region 1 Region 3 y x readout x Effect of Position, Light Level, Threshold • Define 4 regions • 1 -7.5 -2.5m -7.5 -2.5m • 2 -7.5 -2.5m 2.5 7.5m • 3 2.5 7.5m -7.5 -2.5m • 4 2.5 7.5m 2.5 7.5m • Define 6 light level scenarios • 1 10pe far end, threshold • 2 15pe far end, threshold • 3 20pe far end, threshold 20pe • 4 20pe far end, threshold 15pe • 5 20pe far end, threshold 10pe • 6 25pe far end, threshold 20pe
Run Conditions • Run with PJL reconstruction and analysis more or less as at the time of the last PAC submission • Run separately for each region, FOM optimised for each region and light level, changing only • Total pulse height cut • Likelihood selection parameters
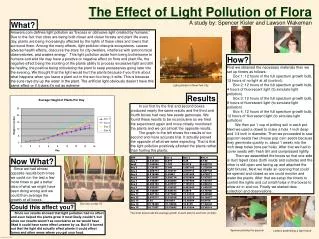
Region 1 Region 3 Region 2 Region 4 Numbers of Selected eEvents Light 10, threshold Light 15, threshold Light 20, threshold 20 Light 20, threshold 15 Light 20, threshold 10 Light 25, threshold 20
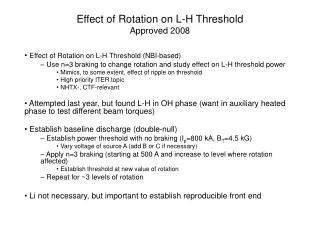
FOM Light 10, threshold Light 15, threshold Light 20, threshold 20 Light 20, threshold 15 Light 20, threshold 10 Light 25, threshold 20 Region 1 Region 3 Region 2 Region 4
Conclusion • Less light, higher threshold means fewer selected eevents • Position in the detector is not very sensitive, only a small loss of events at far side • The FOM is not very sensitive to anything • Fewer selected events but also fewer selected background events
Comparison Ash River – Orr-Buyck • Mark has produced beam spectra for 12km off-axis at Orr-Buyck • Compare with our standard 12km off-axis at Ash River • Minimal reoptimisation, just likelihood parameters, distributions are very similar • Assume old experiment parameters, Mark’s beam is for 3.7 1013 /pulse, 1.9 sec rep-rate, 5 years in a 25kton detector. • As expected, no significant difference