Download
1 / 27
270 likes | 440 Views
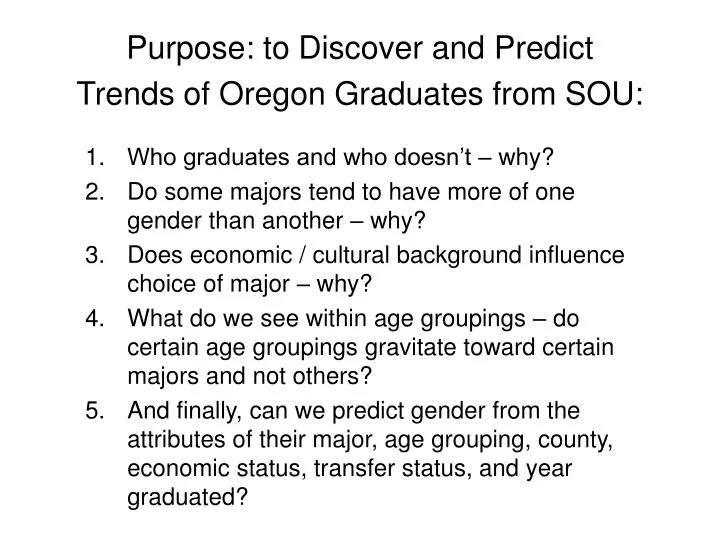
Who graduates and who doesn’t – why? Do some majors tend to have more of one gender than another – why? Does economic / cultural background influence choice of major – why? What do we see within age groupings – do certain age groupings gravitate toward certain majors and not others?

E N D
Who graduates and who doesn’t – why? • Do some majors tend to have more of one gender than another – why? • Does economic / cultural background influence choice of major – why? • What do we see within age groupings – do certain age groupings gravitate toward certain majors and not others? • And finally, can we predict gender from the attributes of their major, age grouping, county, economic status, transfer status, and year graduated? Purpose: to Discover and Predict Trends of Oregon Graduates from SOU:
Data Modeling Tool Used: WEKA • Classification / Prediction: WEKA decision tree (70% accuracy) predicted gender based on attributes of major, age grouping, year of graduation, county, economic status, transfer student. • Clustering (108): Visually shows patterns of trends for combinations of attributes
A 12,982 records of SOU graduates from 1990 to present • 10,491 for training • 2,491 for testing • Attributes • PID • Year graduated {1990 – 2006} • Transfer student or not {Y,N} • County {36} • Economic county status Distressed {1,2,3} • Age (Discretized into 7 categories) • Major {1 - 297} • Gender {F,M} Data
Attribute: major (297) 10,491 Training Set2491 Training SetTotal = 12,982 Decision Tree splits:majorcountytransferagegraduation yeargender @attribute MAJOR1_CODE {GSHU,COMS,HPOL,GSHF,GSIN,GSSM,MSBA,SEFR,SEMT,CSIS,MUCN,SEAT,SEMU,SES,SESP,EESP, SEBI,SEIS,SAAS,ABFA,ACA,AFE,ANTH,ANTP,ARLP,ARLT,ART,ARTH,ARTP,BA,BACH,BAHR,HR,BAMG, BAMK,BAMT,BAMU,BANM,BAOM,BAOP,BAPB,BAPH,BAPM,BARM,BASB,BCHP,BED,BIO,BIOH,BIOP,BMTP, BMUP,BOTC,BUSP,CBIS,CCJ,CHAC,CHBA,CHBI,CHEM,CHEP,CHPA,CIM,COJO,CJOP,CMHR,CMM,COMM, COMP,COBR,COTE,CRIM,CRIP,CRM,CS,CSG,CSIA,CSIN,CSMA,CSP,CSPS,ECD,ECEL,ECON,ECOP,ECTL, ED1P,ED2P,ED3P,ED4P,ED5P,ED6P,ED7P,ED8P,ED9P,EDEC,EDMS,EDP,EDUC,EE,EECI,EECT,EEHE,EEEC, EEHC,EEHL,EERE,EESB,EESL,ESP,EESU,EETS,EIAL,ELED,ELMS,EMAT,EMBE,EMBI,EMCH,EMDR,EMFR, EMGE,EMHE,EMIS,EMLA,BAAC,EMMT,EMMU,EMPE,EMPH,EMS,EMSP,EMSS,ENG,ENGL,ENGP,ENGR, ENGW,ES,ESB,ESC,ESG,ESGR,ESSP,FPA,GEGP,GEOG,GEOL,GEOP,GSBE,GSSS,HISP,HIST,HPAT,HPE, HPHP,HPP,HPPE,HPHS,HSP,HUM,INDP,INTD,INTP,INTS,LAFP,LAGP,LANC,LANF,LANG,LANS,LASP,MACS,MAP, MATH,MBA,MECI,MEEC,MERE,MESP,MHAT,MHBE,MHBI,MHCH,MHDR,MHFR,MHGE,MHHE,MHHP, MHIS,MHLA,MHMT,MHMU,MHPE,MHPH,MHS,MHSP,MHSS,MIM,MIMP,MMC,MMST,MSSP,MTAT,MTBE,MTBI, MTCH,MTDR,MTFR,MTGE,MTHE,MTHH,MTHP,MTIS,MTLA,MTMT,MTMU,MTPE,MTPH,MTRE,MTS,MTSE, MTSP,MTSS,MUIN,MUPF,MUS,MUSP,NAAM,NURP,NURS,PCHM,PCJO,PDEM,PDEN,PDHY,PEGR,PHR, PHYA,PHYP,PHYS,PLAW,PMED,PMET,POLP,POLS,POPT,POTH,PPAS,PPHA,PPTH,PRAM,PSY,PSY2,PSY3, PSY4,PSY5,PSY6,PSY7,PSYA,PSYC,PSYP,PVET,SCI,SCIP,SCTL,SEBE,SED,SEHC,SEHE,SEHL,SEHU,SELA, SEPE,SERE,SESB,SESL,SESM,SESS,SESU,SETS,SOC,SOLP,SPAN,SSCD,SSCI,SSCR,SSHS,SSPD,SSPS, TAFA,TBFA,TEAC,THAR,THEA,THEP,UNDL}
Findings: • Could within 70% accuracy predict F/M for majors (and by following the decision tree you can trace the branching to view the classification of attributes and how they relate) • But, there were other interesting patterns found using clustering (especially socio-economic)
Added Distressed_County Attribute (economic status) • 1. Non Distressed • 2. Distressed • 3. Severly Distressed • And Discretized Age Attribute into 6 Classifications • 1909 – 1939 (67- 97) • 1940 – 1949 (57- 66) • 1950 – 1959 (47- 56) • 1960 – 1969 (37- 46) • 1970 – 1979 (27- 36) • 1980 – 1986 (26 -20) To discover socio-economic correlations I added 1 attribute not in original data:
I had based the Distressed Attribute on: Oregon countieseconomic health • http://www.gonorthwest.com/Oregon/Oregon-cities.htm 3 = Severly Distressed (are all rural)2 = Distressed (except Marion, are non metro)1 = Not Distressed
Map of Counties (socio-economic) http://www.answers.com/topic/list-of-counties-in-oregon 1. Red: distressed (rural)2.Yellow: non-metro (except Marion)3.Blue: not distressed
Most interesting finding:From 1990 to 2006We can see the amount of graduates are far greater from non distressed counties. However the ratio of graduates to non graduates (within each grouping) is extremely disproportionate when you compare groupings. When you compare the ratio of students who graduate (that come from non distressed counties), you see a predominate trend: Students from distressed, and especially from severely distressed counties, who make it to SOU, Graduate.
Speculating the Reason: Financial Motivation Education = Increased Income
Non transfer students were the predominent graduatesJackson, Jefferson, Josephine and Klamath represented transfer studentsIt looks like graduates coming from a distance know they want to attend SOU right out of high school.
Classified by major and transfer/non transfer:There was no indication of any particular major being the motivation, however our tuition is relatively lower (state) – a possible motivator.
Other Trends that were noted:Male (right)/ Female (left) ratio is about the same per economic strata
The age groupings by gender are fairly equalGraduates tend to be older students Top to bottom age:1980 – 1986 (26 -20)1970 – 1979 (27- 36)1960 – 1969 (37- 46)1950 – 1959 (47- 56)1940 – 1949 (57- 66)1909 – 1939 (67- 97) Top to bottom age:1980 – 1986 (26 -20)1970 – 1979 (27- 36)1960 – 1969 (37- 46)1950 – 1959 (47- 56)1940 – 1949 (57- 66)1909 – 1939 (67- 97)
Majors were the first split in the Decision Tree. General trends by clustering could be noted such as Males tended to be ‘sparse’ as English Graduates. Female Graduates were ‘sparse’ in all years within the CS programming track (82% M /17% F). Even in CSIS (79% M, 21% F) with the rest categorized as ‘general CS’ (92%, 8%) for a total of all tracks (81%, 19%)
108 clusters shows clearly the disparity of graduates from certain severely economically distressed counties
Age Groupings and Counties Top to bottom age:1980 – 1986 (26 -20)1970 – 1979 (27- 36)1960 – 1969 (37- 46)1950 – 1959 (47- 56)1940 – 1949 (57- 66)1909 – 1939 (67- 97)
Jitter pulled back to show our near neighbors (bottom):Douglas, Jackson, Josephine, Klamath
Age Groupings of Near Neighbor Graduates Left to right age:1909 – 1939 (67- 97)1940 – 1949 (57- 66)1950 – 1959 (47- 56)1960 – 1969 (37- 46)1970 – 1979 (27- 36)1980 – 1986 (26 -20)
(distressed) Josephine county produced one female CSIN major graduate (in the year 2000) – not definitive as I was clicking on instances (to see what I could find) and could have missed another female from this county.
Listing by County, Number of Graduates#Max-min number of graduates: 4854 Jackson (near neighbor), 581 Multnomah (Distant) (Wheeler 0, Gilliam 2 distant), Lake 39, Harney 25, Grant 9, Malheur 22, Crook 20