Download
1 / 1
20 likes | 166 Views
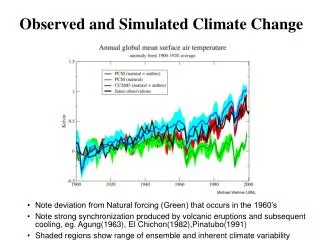
Observed. US-Ho1. Simulated. GPP ( m mol m -2 s -1 ). US-Ha1. Standard Deviation Ratio. GPP ( m mol m -2 s -1 ). C5. C5.1. Daily Ave. SW Radiation (W m -2 ). Observed. Observed. US-Ho1. US-Ho1. Simulated. Simulated. GPP ( m mol m -2 s -1 ). GPP ( m mol m -2 s -1 ). US-Ha1.

E N D
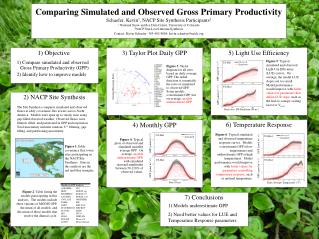
Observed US-Ho1 Simulated GPP (mmol m-2 s-1) US-Ha1 Standard Deviation Ratio GPP (mmol m-2 s-1) C5 C5.1 Daily Ave. SW Radiation (W m-2) Observed Observed US-Ho1 US-Ho1 Simulated Simulated GPP (mmol m-2 s-1) GPP (mmol m-2 s-1) US-Ha1 US-Ha1 GPP (mmol m-2 s-1) GPP (mmol m-2 s-1) Daily Average Temperature (°C) Date (Year) Comparing Simulated and Observed Gross Primary Productivity Schaefer, Kevin1, NACP Site Synthesis Participants2 1 National Snow and Ice Data Center, University of Colorado 2NACP Site-Level Interim Synthesis Contact: Kevin Schaefer: 303-492-8869; kevin.schaefer@nsidc.org 1) Objective 3) Taylor Plot Daily GPP 5) Light Use Efficiency Figure 5: Typical simulated and observed Light Use Efficiency (LUE) curves. On average, the model LUE slopes are too small. Model performance would improve with better values for parameters that define LUE slope, such as the leaf-to-canopy-scaling factor or Vmax. • Compare simulated and observed Gross Primary Productivity (GPP) • Identify how to improve models Figure 3: Taylor diagram for all sites based on daily average GPP. The radial direction is essentially the ratio of simulated to observed GPP. Some models overestimate GPP, but on average, models underestimate GPP 2) NACP Site Synthesis The Site Synthesis compares simulated and observed fluxes at eddy covariance flux towers across North America. Models were spun up to steady state using gap-filled observed weather. Observed fluxes were filtered, filled, and partitioned in GPP and respiration. Total uncertainty includes random, U* filtering, gap-filling, and partitioning uncertainty. 6) Temperature Response 4) Monthly GPP Figure 6: Typical simulated and observed temperature response curves. Models overestimate GPP at low temperatures and underestimate GPP at high temperatures. Model performance would improve with better values for parameters controlling temperature response, such as optimal temperature. Figure 4: Typical plots of observed and simulated monthly average GPP. On average, modelsunderestimate GPP, with simulated seasonal amplitudes between 50-120% of observed values. Figure 1: Eddy covariance flux tower sites participating in the NACP Site Synthesis. Sites in this analysis are the red and blue triangles. Figure 2: Table listing the models participating in this analysis. The models include three variants of MODIS GPP, the mean of all models, and the mean of those models that resolve the diurnal cycle. 7) Conclusions 1) Models underestimate GPP 2) Need better values for LUE and Temperature Response parameters