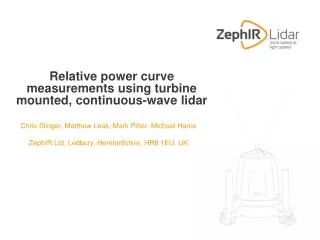
Power performance measured using a nacelle-based lidar
130 likes | 268 Views
Power performance measured using a nacelle-based lidar. Risø DTU Siemens Wind Power A/S DONG Energy Leosphere. R Wagner , TF Pedersen, M Courtney, J Gottschall I Antoniou, R Møller, SM Pedersen N Le, AS Mouritzen T Velociter, M Bardon EWEC 2011 Brussels. Project. Main objective:

Power performance measured using a nacelle-based lidar
E N D
Presentation Transcript
Power performance measured using a nacelle-based lidar Risø DTU Siemens Wind Power A/S DONG Energy Leosphere R Wagner, TF Pedersen, M Courtney, J Gottschall I Antoniou, R Møller, SM Pedersen N Le, AS Mouritzen T Velociter, M Bardon EWEC 2011 Brussels
Project Main objective: To demonstrate that a nacelle lidar can be an alternative to a mast for power performance measurement whilst applying the IEC61400-12-1 procedure as close as possible First phase: Testing the lidar on the nacelle of a multi MW turbine onshore.
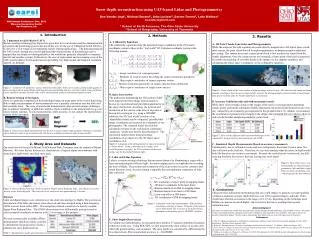
removes 1.5% of data Lidar/Cup anemometer • Data selection: • wind direction between 220 and 320 degrees; • turbine operating normally; • data with exceptionally high CNR max or CNR st. dev. were removed (laser hitting the mast); • 10 min lidar availability>30%.
Nacelle Tilt & Roll • Error in sensing height at 2.5D: • tilt between -0.6°and +0.2° • measure between zhub and zhub +4m Change in tilt and roll Change in vertical angle of the line-of-sights (LOS) • inclinometers must be calibrated in relation to the beam (resolution of 0.05°required) • tilt and roll effect is a minor issue here • only problem in case of strong wind shear Error in sensing height
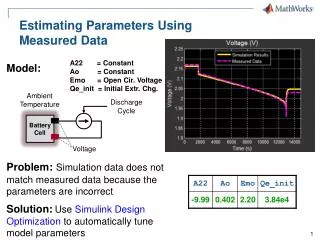
Power curve for westerly winds Mast top mounted cup at hub height west from turbine Nacelle lidar measuring at the same height and the same distance as the cup Smaller scatter with the nacelle lidar than with the cup
Power curve for westerly winds Bin-averaged power curves cup lidar Very close mean power curves
Power curve for easterly winds Mast top mounted cup at hub height west from turbine Nacelle lidar measuring on the east side The lidar is not disturbed by the turbine wake while the mast is.
Power curve for easterly winds Nacelle lidar measurements from both sectors together West East Same power curve for easterly winds as for westerly winds!
Conclusions • Good agreement of the nacelle lidar wind speed with the cup anemometer at hub height • However 1% difference, probably due to various uncertainties • The nacelle motion does not significantly affect the lidar measurements in this campaign (stiff turbine). • Lidar measurements result in a comparable power curve to that obtained with the cup anemometer • Always measures upwind better correlation larger wind sector faster power curve measurements
Thank you for your attention Rozenn Wagner Risø DTU rozn@risoe.dtu.dk