Download
1 / 36
360 likes | 449 Views
Explore the process of land cover mapping, predicted vertebrate distribution, stewardship lands, and analysis of gaps in Vermont and New Hampshire. Utilize habitat models and maps for 306 terrestrial vertebrates.

E N D
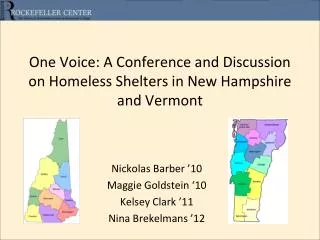
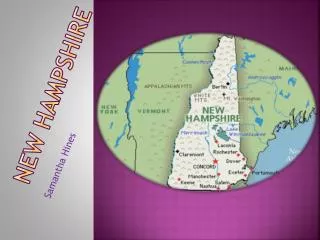
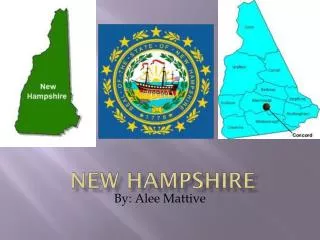
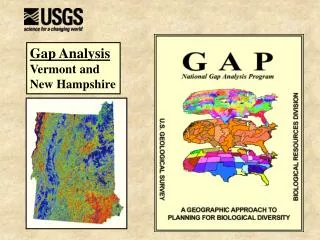
Gap Analysis Vermont and New Hampshire
The Process • Land cover mapping • Predicted vertebrate distribution • Stewardship lands • Analysis of gaps
VT-NH GAP has predictive habitat models and maps for 306 terrestrial vertebrates Species Richness 202 birds 59 mammals 23 amphibians 22 reptiles
Land cover mapping TM Imagery, 1992-93; Summer and fall scenes; Supervised classification; Details www.snr.uvm/sal
Land cover mapping Aerial videography used to collect training and validation data
Predicted vertebrate distribution 1. Delineate range of each species by biophysical regions
Predicted vertebrate distribution 2. Intersect with suitable habitat types from land- cover map
Predicted vertebrate distribution Example for blackpoll warbler: forested land cover within selected regions
Predicted vertebrate distribution 4. Modify with elevational data to produce map of predicted distribution
Two-lined Salamander Gray Jay S. Flying Squirrel • Predicted vertebrate distribution
VT-NH Gap Analysis for Northern Harrier Green = predicted habitat Salmon = protected lands Red = overlap Result: only 6.7% of habitat in NH is on protected land; 11% in VT.
Analysis of gaps Tabular data for each vertebrate showing acres of habitat by ownership and protection category
Human settlement Vertebrate richness
Analysis of gaps 23 Threatened and Endangered species
VT-NH Gap Analysis: The Bottom Line Vertebrate Richness Protected Lands
Vermont Biodiversity Project Objective: To design and map a system of conservation areas that protects the full diversity of landscapes, natural communities, and species.
Richness Atlas data and Gap Analysis predictions
Landscape • Diversity Units • (LDU) • Bedrock • Surficial • Elevation • Landform Landform: Lower slideslope Surficial material: Till Bedrock: Granite Elevation zone: 1700-2500
Representativeness Objective analysis of landscape features
Representative Landscapes of Vermont • 21 % of area of state • 89 % of landscape • richness • 95 % landscape • similarity
VT-NH Gap Analysis Vertebrate Richness Landscape Diversity
LDUs = 1408 Vertebrates = 292 494 265
20% of state: 7 5 8 2 6 • 88% of LDUs • 97% of vertebrates 1 4 9 3 10
Heritage Program Elements of Occurrence “EORs” • 6349 EORs • 16% on status 1 & 2 • stewardship lands
EORs = 4958 Vertebrates = 292 325 243
10% of state: 7 6 2 3 • 19% of EORs • 97% of vertebrates 8 20% of state: 1 9 • 24% of EORs • 97% of vertebrates 10 4 5