Download
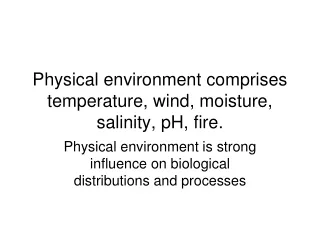
1 / 3
30 likes | 157 Views
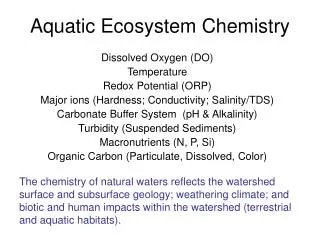
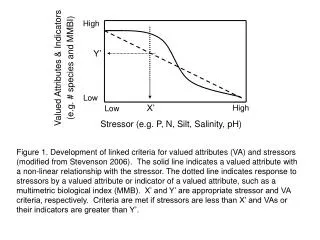
High. Y’. Valued Attributes & Indicators (e.g. # species and MMBI). Low. X’. High. Low. Stressor (e.g. P, N, Silt, Salinity, pH).

E N D
High Y’ Valued Attributes & Indicators (e.g. # species and MMBI) Low X’ High Low Stressor (e.g. P, N, Silt, Salinity, pH) Figure 1. Development of linked criteria for valued attributes (VA) and stressors (modified from Stevenson 2006). The solid line indicates a valued attribute with a non-linear relationship with the stressor. The dotted line indicates response to stressors by a valued attribute or indicator of a valued attribute, such as a multimetric biological index (MMB). X’ and Y’ are appropriate stressor and VA criteria, respectively. Criteria are met if stressors are less than X’ and VAs or their indicators are greater than Y’.
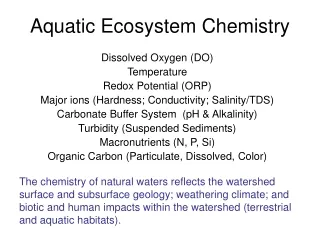
High Y’ Valued Attributes & Indicators (e.g. # species and MMBI) Y’’ Low X’ X’’ High Low Stressor (e.g. P, N, Silt, Salinity, pH) Figure 2. Development of tiered and linked criteria for valued attributes (VA) and stressors. The dotted line indicates response to stressors by a valued attribute or indicator of a valued attribute, such as a multimetric biological index (MMB). X’’ and Y’’ are appropriate stressor and VA criteria, respectively, to support a minimally acceptable level of VA; whereas X’ and Y’ are appropriate stressor and VA criteria to protect higher quality waters.
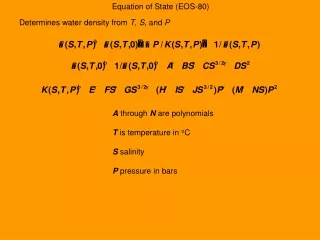
Pollution Concentration Lowest Highest A B C M 1 2 M Scenario M 3 M 4 Figure 3. Four assessment scenarios for a waterbody. Three tiered pollution criteria (A, B, C) exist for waters in the region. B is the criterion for this example waterbody. In scenarios 1, 2, and 3, measured concentrations of a pollutant (M) are less than B, so use of this water is supported in all scenarios. In both scenarios 1 and 2, M falls within the range between the criteria for use A and B. In scenario 3, M would support designated use for both A and B, so reassigning a higher use for this waterbody could be considered. In scenario 4, M is less than B, so the designated use of the waterbody is not attained. Even though the use for C is met, the designated use of the waterbody in this examples is higher (B) and a TMDL should be established to restore acceptable conditions.