Download
1 / 20
210 likes | 565 Views
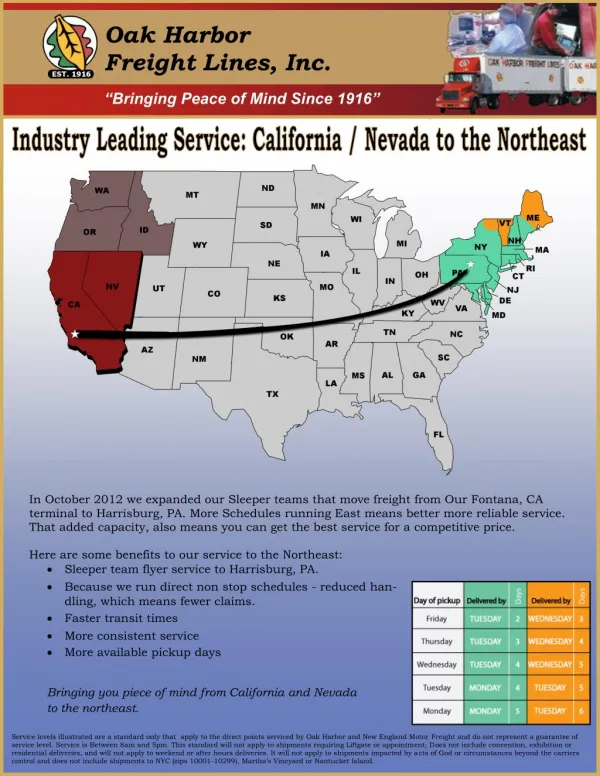
EVALUATION OF TRANSPORTATION PRACTICES IN THE CALIFORNIA CUT FLOWER INDUSTRY. Selin Atalay. BACKGROUND. California’s share dropped from 64% to 20% In 2006, $316 million in cut flower industry = 77% of total US production Competition with South American growers increased

E N D
EVALUATION OF TRANSPORTATION PRACTICES IN THE CALIFORNIA CUT FLOWER INDUSTRY Selin Atalay
BACKGROUND • California’s share dropped from 64% to 20% • In 2006, $316 million in cut flower industry = 77% of total US production • Competition with South American growers increased • South American growers use cross-docking and distribution center in Miami
BACKGROUND • A single consolidation and pick up location for South American growers • Trucking delivery rates drop because of their huge volume • Californian growers ship individualy • Price is reflected on the customer
BACKGROUND • California Cut Flower Commission (CCFC) wants to open a consolidation center in Oxnard • 36 growers in Oxnard, 12 in San Diego, and 22 inWatsonville • Aim is to drop transportation costs
RELEVEANT LITERATURE • Two customer types - use third party carriers -employ their own transportation network • Considerations -Highly perishable product -limit on time it spends in transit and in inventory -How to ship? Full truckload rate, Less-than-truckload rate,courier services....
DATA ANALYSIS • and 20108 • 7 producersprovided data forboth 2008 and 2010 • 4 producersprovided data foronly 2008
METHODOLOGY • Twomodelsareconsidered -Baseline -Consolidation • Assumptions: -Simulation time is 365 days -maximumtrailervolume is 2600 cubicfeet - LTLandFTLratesareprovided