Download
1 / 31
310 likes | 460 Views
MIM 514 Global Sourcing Class seven. Agenda. Inventory & Variances Basics Is it good & why / why not Cisco & Altera Inventory Bubble Scientific Glass Case Analysis Student Analysis. Costs Associated with Goods for Sale. 1. Purchasing costs include NPI thru transportation costs.

E N D
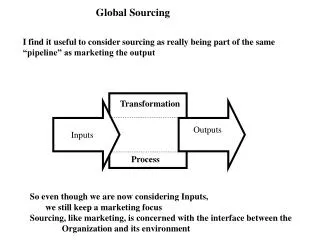
MIM 514 Global Sourcing Class seven
Agenda • Inventory & Variances • Basics • Is it good & why / why not • Cisco & Altera Inventory Bubble • Scientific Glass Case Analysis • Student Analysis
Costs Associated withGoods for Sale 1. Purchasing costs include NPI thru transportation costs. 2. Ordering costsinclude receiving, inspecting the items in the orders, as well as well as RMAs for defects . 3. Carrying costsinclude the opportunity cost of the investment tied up in inventory and the costs associated with storage. Amplified by return privileges.
Costs Associated withGoods for Sale 4. Stock-out costsoccur when an organization runs out of a particular item for which there is a customer demand, far higher than inventory costs. 5. Quality costs of a product or service is its lack of conformance with a pre-specified standard. Again, far higher than inventory carry costs.
Inventory Carry Costs – Is inventory an asset? • Inventory Carrying rate example: total inventory = $34,400 • $800K – Storage • $400K – Handling • $600K – Obsolescence • $800K – Damage • $600K – Administrative • $200K – Loss • $3,400 – Total • Divide costs by Avg Inventory $3,400 / $34,400 = 10% • Add: Opportunity costs of Capital 9%, Insurance 4%, Taxes 6% =19% • Total Inventory carrying rate is 29%
Cash-to-Cash Cycle Time 0ENLI009 Inventory days + Days sales outstanding – Average payment of supply period for materials 0ENLI015 0ENLI003 0OPPLAN017 Faultless Invoices 0OPDEL023 Returns 0OPDEL067 Sales 0ENPR026 Inventory 0OPPLAN012 Number of Supply Sources 0OPSO012 Order Fulfillment Lead Time 0OPPLAN030 Perfect Order Fulfillment 0OPDEL061 Total Source Lead Time 0OPSO041 Fill Rates 0OPDEL025 Forecast Accuracy 0OPPLAN008 Scheduled Achievement 0OPMAKE022 Delivery Performance to Scheduled Commit Date 0OPDEL019 Production Lead Times 0OPMAKE017 Yield 0OPMAKE033 Scrap 0OPMAKE023 Machine wait time 0OPMAKE007
Reasons for Inventories • Improve customer service • Economies of purchasing • Economies of production • Transportation savings • Hedge against future • Unplanned shocks (labor strikes, natural disasters, surges in demand, etc.) • To maintain independence of supply chain
Adding Value through Inventory • Quality - inventory can be a “buffer” against poor quality; conversely, low inventory levels may force high quality • Speed - location of inventory has gigantic effect on speed • Flexibility - location, level of anticipatory inventory both have effects • Cost - direct: purchasing, delivery, manufacturing • indirect: holding, stock-out.
Which begs the question “who is liable?” : • Need for Finished Goods Inventories • Is the need to satisfy internal or external customers? • Can someone else in the value chain carry the inventory? • Ownership of Inventories • Specific Contents of Inventories • Locations of Inventories • Tracking
Supply Chain Management – Key Issues • Forecasts are never right • Very unlikely that actual demand will exactly equal forecast demand • The longer the forecast horizon, the worse the forecast • A forecast for a year from now will never be as accurate as a forecast for 3 months from now • Aggregate forecasts are more accurate • A demand forecast for all “related products” will be more accurate than a forecast for a specific product / SKU Nevertheless, forecasts (or plans, if you prefer) are important management tools when some methods are applied to reduce uncertainty
Purchasing Manufacturing Distribution Customer Service/ Sales Low pur-chase price Multiple vendors Few change- overs Stable schedules Long run lengths High inventories High service levels Regional stocks Low invent-ories Low trans-portation SOURCE MAKE DELIVER SELL Supply Chain Management – Key Issues • Overcoming functional silos with conflicting goals
Economic-Order-Quantity Decision Model: One of many metrics to balance Inv. EOQ = D = Demand in units for a specified time period P = Relevant ordering costs per purchase order C = Relevant carrying costs of one unit in stock for the time period used for D
Supply Chain Integration – Pull Strategies • Production and distribution are demand-driven • Coordinated with true customer demand • None or little inventory held • Only in response to specific orders • Fast information flow mechanisms • POS data • Decreased lead times • Decreased retailer inventory • Decreased variability in the supply chain and especially at manufacturers • Decreased manufacturer inventory • More efficient use of resources • More difficult to take advantage of scale opportunities • Examples:
Supply Chain Integration – Push/Pull Postponement • Hybrid of “push” and “pull” strategies to overcome disadvantages of each • Early stages of product assembly are done in a “push” manner • Final product assembly is done based on customer demand for specific product configurations • Supply chain timeline determines “postponement boundary” Post- ponement Boundary “Generic” Product “Customized” Product Push Strategy Pull Strategy Raw Materials Endconsumer Supply Chain Timeline
Inventory Measures - Examples • Weeks of Supply • Ford: 3.51 weeks • Sears: 9.2 weeks • Inventory Turnover (Turns) • Ford: 14.8 turns • Sears: 5.7 turns • GM: 8 turns • Toyota: 35 turns
Variances are bad – PPV & Standards • “unfavorable variance” = is reduced from the budgeted expectation • “favorable variance” = is increased from budgeted expectation • When is cost reduction a bad thing? • Note: Do not interpret directly as “bad” or “good” behavior on the part of management; the goal is to be on target.
Important points to keep in mind • Segment customers based on service needs. • Modify the supply chain to meet these service requirements profitably. • Customize the logistics network. • Develop forecasts collaboratively involving every link of the supply chain. • Locate the leverage point where the product is unalterably configured to meet a single requirement • Delay product differentiation till the last possible moment.
Assess options such as modularized design or modification of manufacturing processes that can increase flexibility. • Cultivate strong relationships (guanxi) with suppliers. • Efficient supply chain management has to be accompanied by a technology strategy.
Cisco / Altera • Yr. 2000 – Cisco wrote off $2.25B • Altera’s answer? – A new Postponement • Capacity utilization – 2000 (97%) 2001 (66.2%) What should it be? • What is happening now in component lead-times? Is it real? • Is VMI the real answer? • Value drops 1.3% per month
Scientific Glass • Helpful Hints: • What are the Options & savings with each? • Fill rate lowered & trunk stock eliminated • One Warehouse vs. logistics costs • Outsource • Combination of the above? • What about Cash????
Scientific Glass • Case Questions: • What are the problems facing SG in January 2010? • How much external funding will have to be raised in 2010 to finance ops? • How so SG’s problems illustrate the relationship between the number of warehouses and inventory levels? • What are the alternatives & how do you evaluate those? • What actions should Ava propose?
Scientific Glass • Assessment alternatives: 5 questions • Implement proposed policy changes? • Consolidate warehouses? • Outsource warehousing? • Reduce the target total order fill-rate? • Other considerations?
Scientific Glass – Inventory Case • What we know: • Exceeded their target debt/capital of 40% • $2B market; 5% share • High volume / low mix? 3000SKUs • Niche player, custom SKUs, competitive pressure. • Does the 3-6 month sales cycle matter to SCM? • Inventory growing faster than sales • Emphasis on short lead-times & customer satisfaction
Scientific Glass – Inventory Case • What do we know? • Dedicated Sales force – Trunk stock 32*$10K • 93% fill-rate, 2 week lead-time • Overage cost .6%. BO 10% GM. • Incentive is on fill-rate to 99% • 8 DCs * $750K + 2 new ones planned • Sales forecasted to grow 20%; Capacity requested to support = $10M
Scientific Glass – Inventory Case • What do we know? • Warehouse Inventory <60days; 120K orders processed • Used Min-Max system for each SKU • Period expenses of 1% of cogs – Too much? • Freight Factory -> DC is $.4 / Ilbs • Inventory accuracy was declining – what happens?
Scientific Glass – Inventory Case • What do we know? • Policy changes proposed • Capex is low – 14% ($1.4M..) • Turns were 6 • 25% is Raw + WIP; rest is FGI (good?) • Balance sheet – Inventory growth > Sales • Cash 6%
Scientific Glass • Option 1 – Implement proposals • These fail to address the problems of too high fill-rate target & # of warehouses. • Too enamored with the metric fill-rate; what do customers really want? Lower it to find the “sweet spot” and change Sales commission to “order” not “shipment” • Trunk stock is negligible, keep it to make sales happy while changing their commission structure.
Scientific Glass • Option 2 – Consolidating Warehouses • By going from 8 warehouses to 2, even with a 99% fill-rate they can reduce inventory ~25%, 1 then ~40%. • Warehouse in Waltham is the largest and appears to have capacity to fill all orders. • Cost of the each warehouse is 15% of the inventory value saving $800K. • Downside is freight – 145K orders equates to $400K in increased costs.
Scientific Glass • Option 3 – Outsource Warehousing • Winged Fleet could operate all distribution functions. • Save similar to option 2 • Higher shipping costs due to region fees of ~$800K • Increase savings if outsourcing packaging & order fulfillment would save incremental $$. • Least interesting unless outsourcing is your fundamental strategy
Scientific Glass • Option 4 – Lower target fill-rate • 95% might reduce: • inventory by ~$1M • Operating expenses by ~$125K • E&O by 15% - 40% pending SKU analysis
Scientific Glass • The real savings: • Cash saved by not increasing the capacity since inventory is not needed. • Saving $10M • Shipments to new regions could be a 3PL strategy