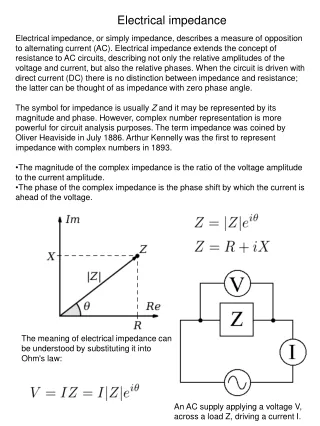
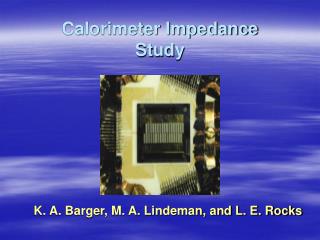
Calorimeter Impedance Study
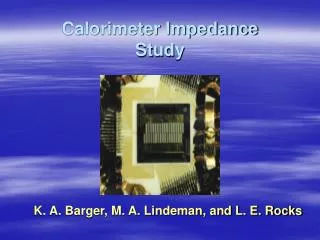
Calorimeter Impedance Study. K. A. Barger, M. A. Lindeman, and L. E. Rocks. Designing a Rocket payload to study the diffuse X-ray Background in the Galactic ISM. This rocket will travel to the upper atmosphere of Earth and collect data for ~5min

Calorimeter Impedance Study
E N D
Presentation Transcript
Calorimeter ImpedanceStudy K. A. Barger, M. A. Lindeman, and L. E. Rocks
Designing a Rocket payload to study the diffuse X-ray Background in the Galactic ISM • This rocket will travel to the upper atmosphere of Earth and collect data for ~5min • The last rocket flight was able to detect O VII, O VIII, C VI, and some silicon ions. This information can be used to: • Investigate the galactic evolutionary processes. • Determine the types and quantities of baryons which are important to Cosmology.
The detectors • The payload of the rocket contains 36 microcalorimeter detectors. • Each of these detectors is composed of a silicon thermistor that is thermally connected to a HgTe absorber. • Operate at 60mK for low thermal noise. • They are highly sensitive detectors that detect small changes in energy. They are so sensitive that they are able to measure the energy of single X-ray photons to a part in ~1000.
Why Studying the Impedance of the Detectors is Important • The impedance measurements can be used to determine the Heat Capacity of the detectors. • It is important to know the Heat Capacity because: The lower the Heat Capacity • The more the temperature of the detector will change from a given amount of energy of an X-ray. • The better the signal to noise ratio.
Analogy • Similarly, if you have a microcalorimeter that has some impedance and introduce a bias voltage to the circuit and an oscillating current, then the behavior of the impedance over a broad range of frequencies will yield information about the Heat Capacity. Remember that the impedance is frequency dependent. • Take mass on a spring that is able to oscillate one dimensionally in response to a driving force. Measuring the behavior of the spring that over a broad range of frequencies enables you to determine the mass that is on the spring. An ideal model of a thermal detector consists of a heat capacity (C) connected to a heat sink through a weak thermal link (G).
Why is my Research Important? The current model for the impedance in the circuit used to bias the detector is inaccurate in describing the physical effects that are taking place within the circuit and does not match with the collected data. Additional lobe The predicted and ideal behavior of this curve for this particular detector is one that curves in a semicircle manner and does not have any additional lobes Curves diverge
The Circuit • V* – Voltage at point V • V1* – Voltage In • V2* – Voltage Out • Vb* – Voltage bias • RL* – Load Resister • ZL – Load Impedance • Zd – Detector Impedance • Z – Stray Impedance
Current vs. Norton-R To determine VTh and ZTh, I plotted I-1vs. RNor. However, this linear relationship is hard to see and it gets increasingly inaccurate at high frequencies. To see the linear behavior of this graph better I only plotted the data for the frequencies at the 10n power. The data below 1000Hz was relatively smooth data. Intercept Slope
Thevenin Impedance From the intercept and the slope of the line, Zth was found. As shown, Zth changes with frequency.
Thevenin Voltage From the slope of the line, Vth was found. As shown, Vth also changes with frequency.
Results Remember that the predicted and ideal behavior of this curve for this particular detector is one that curves in a semicircle manner and does not have any additional lobs!!!!
Applications of the New Impedance Model Now that the behavior of the detector’s Impedance is known, the thermal conductivities, and heat capacities can be determined from measurements of the resistance versus temperature relationship. This enables us to adjust the materials that the detectors are made from to ensure maximum efficiency The lower the Heat Capacity • The more the temperature of the detector will change from a given amount of energy of an X-ray. • The better the signal to noise ratio.
Recap • We are able to determine the Thevenin and Norton equivalent bias circuits of the microcalorimeterby measuring the Voltage across the circuit. • This information can be then used to determine the impedance of the detectors. This information can then be used to determine the Heat Capacity of the detectors. • By knowing the Heat Capacity of the detectors, we are able to optimize the detectors sensitivity.
References • J.E. Vaillancourt, Rev. Sci. Instrum. 76, 043107 (2005). • M. A. Linderman, S. Bandler, R. P. Brekosky, J. A. Chervenak, E. Figueroa-Feliciano, F. M. Finkbeiner, M. J. Li, and C. A. Kibourne, Rev. Sci. Instrum. 75, 5 (2004). • J. J. Brophy, 1990, Basic Electronics for Scientist (USA:McGraw-Hill, Inc.) • Wikibooks http://en.wikibooks.org/wiki/Electronics:Thevenin/Norton_Equivalents • A. J. Diefenderfer, B. E. Holton, 1994, Principles of Electronic Instrumentation • X-ray Astrophysics, University of Wisconsin http://wisp11.physics.wisc.edu/xray/xr_microcalorimeters.htm
Acknowledgments I would like to thank the REU program at University of Wisconsin-Madison. I would also like to thank my mentor Dan McCammon as well as Mark Lindeman, and Lindsey Rocks their help and guidance. This work is based upon research conducted at the University of Wisconsin-Madison, which is supported by the NSF