Sign Test for a Population Median: Hypothesis Testing Without Population Assumptions
Learn to perform Sign Test for a population median with nonparametric methods, no population assumptions required. Understand left-tailed, right-tailed, and two-tailed tests. Follow step-by-step instructions, with examples and calculations. Sample sizes, test statistics, critical values, and decision-making processes are explained in detail.


Sign Test for a Population Median: Hypothesis Testing Without Population Assumptions
E N D
Presentation Transcript
Chapter 11 Nonparametric Tests
The Sign Test § 11.1
Sign Test for a Population Median A nonparametric test is a hypothesis test that does not require any specific conditions concerning the shape of the population or the value of any population parameters. The sign test is a nonparametric test that can be used to test a population median against a hypothesized value k. The sign test for a population median can be left tailed, right tailed, or two tailed. Left-tailed test: H0: median k andHa: median < k Right-tailed test: H0: median k andHa: median > k Two-tailed test: H0: median = k andHa: median k
Sign Test for a Population Median To use the sign test, each entry is compared with the hypothesized median. If the entry is below the median, a sign is assigned; if above the median, a + sign is assigned. Test Statistic for the Sign Test When n 25, the test statistic x for the sign test is the smaller number of + or signs. When n > 25, the test statistic for the sign test is where x is the smaller number of + or signs and n is the sample size, i.e., the total number of + or signs.
Sign Test for a Population Median Performing a Sign Test for a Population Median In Words In Symbols • State the claim. Identify the null and alternative hypotheses. • Specify the level of significance. • Determine the sample size n by assigning + signs and – signs to the sample data . • Determine the critical value. State H0 and Ha. Identify . n = total number of + and – signs If n 25, use Table 8. If n> 25, use Table 4. Continued.
Sign Test for a Population Median Performing a Sign Test for a Population Median In Words In Symbols If n 25, use x. If n > 25, use • Calculate the test statistic. • Make a decision to reject or fail to reject the null hypothesis. • Interpret the decision in the context of the original claim. If x or z is in the rejection region, reject H0. Otherwise, fail to reject H0.
Sign Test for a Population Median Example: A college statistics professor claims that the median test score for his students’ last test is 58. The scores for 18 randomly selected tests are listed below. At = 0.01, can you reject the professor’s claim? H0: median = 58 (Claim) Ha: median 58 Determine the values that are above and below the median of 58. There are 6 + signs and 10 signs. Continued.
Sign Test for a Population Median Example continued: Since there are 6 + signs and 10 signs, n = 6 + 10 = 16. Using Table 8 with = 0.01 (two tailed) and n = 16, the critical value is 2. Because n 25, the test statistic x is the smaller number of + signs or signs, so x = 6. 6 is greater than the critical value, so we fail to reject H0. There is not enough evidence at the 1% level to reject the professor’s claim that the median test score is 58.
The Paired-Sample Sign Test Thepaired-sample sign test is used to test the difference between two population medians when the populations are not normally distributed. For the paired-sample sign test to be used, the following must be true. • A sample must be randomly selected from each population. • The samples must be dependent (paired). The difference between corresponding data entries is found and the sign of the difference is recorded.
The Paired-Sample Sign Test Performing a Paired-Sample Sign Test In Words In Symbols State H0 and Ha. • Identify the claim. State the null and alternative hypotheses. • Specify the level of significance. • Determine the sample size n by finding the difference for each data pair. Assign a + sign for a positive difference, a – sign for a negative difference, and a 0 for no difference. Identify . n = total number of + and – signs Continued.
The Paired-Sample Sign Test Performing a Paired-Sample Sign Test In Words In Symbols • Determine the critical value. • Find the test statistic. • Make a decision to reject or fail to reject the null hypothesis. • Interpret the decision in the context of the original claim. Use Table 8 in Appendix B. x = lesser number of + and – signs If the test statistic is less than or equal to the critical value, reject H0. Otherwise, fail to reject H0.
The Paired-Sample Sign Test Example: Students at a certain school are required to take the SAT twice. The table shows both verbal SAT scores for 12 students. At = 0.05, can you conclude that the scores improved the second time they took the SAT? There are 8 + signs and 4 signs. Continued.
The Paired-Sample Sign Test Example continued: H0: The SAT scores have not improved. Ha: The SAT scores have improved.(Claim) Since there are 8 + signs and 4 signs, n = 8 + 4 = 12. Using Table 8 with = 0.05 (one tailed) and n = 12, the critical value is 2. The test statistic x is the smaller number of + signs or signs, so x = 4. 4 is greater than the critical value, so we fail to reject H0. There is not enough evidence at the 5% level to support the claim that verbal SAT scores improved.
The Wilcoxon Tests § 11.2
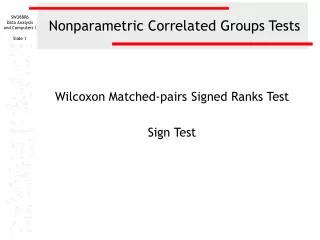
The Wilcoxon Signed-Rank Test The Wilcoxon signed-rank test is a nonparametric test that can be used to determine whether two dependent samples were selected from populations having the same distribution. Performing a Wilcoxon Signed-Rank Test In Words In Symbols • Identify the claim. State the null and alternative hypotheses. • Specify the level of significance. • Determine the sample size n. State H0 and Ha. Identify . Continued.
The Wilcoxon Signed-Rank Test Performing a Wilcoxon Signed-Rank Test In Words In Symbols • Determine the critical value. • Calculate the test statistic ws. • Complete a table with the following headers: • Find the sum of the positive ranks and the sum of the negative ranks. • Select the smaller of absolute values of the sums. Use Table 9 in Appendix B. Headers: Sample 1, Sample 2, Difference, Absolute value, Rank, and Signed rank. Continued.
The Wilcoxon Signed-Rank Test Performing a Wilcoxon Signed-Rank Test In Words In Symbols • Make a decision to reject or fail to reject the null hypothesis. • Interpret the decision in the context of the original claim. If ws is less than or equal to the critical value, reject H0. Otherwise, fail to reject H0.
The Wilcoxon Signed-Rank Test Example: A medical researcher want to determine whether a new drug affects the number of headache hours experienced by headache sufferers. To do so, he selects seven patients and asks each to give the number of headache hours (per day) each experiences before and after taking the drug. The results are shown in the table. At = 0.05, can the researcher conclude that the new drug affects the number of hours? H0: The drug does not affect the number of headache hours. Ha: The drug does affect the number of headache hours. (Claim) This is a two-tailed signed-rank test with = 0.05 and n = 7. From Table 9, the critical value is 2. Continued.
The average of rank 5, 6, and 7 is used for these. The Wilcoxon Signed-Rank Test Example continued: The sum of the negative ranks is 6. The sum of the positive ranks is 22. Continued.
The Wilcoxon Signed-Rank Test Example continued: The test statistic is the smaller of the absolute value of the two sums. |6| = 6 |22| = 22 ws = 6 which is greater than the critical value of 2. Fail to reject H0. There is not enough evidence at the 5% level to support the claim that the drug affects the number of headache hours.
The Wilcoxon Rank Sum Test TheWilcoxon rank sum test is a nonparametric test that can be used to determine whether two independent samples were selected from populations having the same distribution. A requirement for the Wilcoxon rank sum test is that the sample size of both samples must be at least 10. n1 represents the size of the smaller sample and n2 represents the size of the larger sample. When calculating the sum of the ranks R, use the ranks for the smaller of the two samples.
The Wilcoxon Rank Sum Test Test Statistic for the Wilcoxon Rank Sum Test Given two independent samples, the test statistic z for the Wilcoxon rank sum test is where R = sum of the ranks for the smaller sample, and
The Wilcoxon Rank Sum Test Performing a Wilcoxon Rank Sum Test In Words In Symbols • Identify the claim. State the null and alternative hypotheses. • Specify the level of significance. • Determine the critical value. • Determine the sample sizes. State H0 and Ha. Identify . Use Table 4 in Appendix B. n1 n2 Continued.
The Wilcoxon Rank Sum Test Performing a Wilcoxon Rank Sum Test In Words In Symbols R • Find the sum of the ranks for the smaller sample. • List the combined data in ascending order. • Rank the combined data. • Add the sum of the ranks for the smaller sample. • Calculate the test statistic. Continued.
The Wilcoxon Rank Sum Test Performing a Wilcoxon Rank Sum Test In Words In Symbols • Make a decision to reject or fail to reject the null hypothesis. • Interpret the decision in the context of the original claim. If z is in the rejection region, reject H0. Otherwise, fail to reject H0.
The Wilcoxon Rank Sum Test Example: An industry analyst claims that there is no difference in the salaries earned by workers in the manufacturing and construction industries. A random sample of 10 manufacturing and 10 construction workers and their salaries is shown below. At = 0.10, can you reject the analyst’s claim? (Adapted from US Bureau of Labor Statistics) H0: There is no difference between the salaries. (Claim) Ha: There is a difference between the salaries. Continued.
The Wilcoxon Rank Sum Test Example continued: Because the test is a two-tailed test with = 0.10, the critical values are z0 = 1.645 and z0 = 1.645. The rejection regions are z 1.645 and z 1.645. To find the values of R, μR, andR, construct a table that shows the combined data in ascending order and the corresponding ranks. Continued.
The Wilcoxon Rank Sum Test Example continued: Continued.
The Wilcoxon Rank Sum Test Example continued: Because the samples are the same size, n1 can be associated with either sample. If we let n1 be the sample of the construction workers, then R is the sum of the construction rankings. R = 1 + 2 + 3 + 5.5 + 5.5 + 7.5 + 9 + 11.5 + 14 + 15.5 = 74.5 Using n1 = 10 and n2 = 10, we can find μR, andR. Continued.
The Wilcoxon Rank Sum Test Example continued: When R = 74.5, μR = 105 andR = 13.23, the test statistic is Since 2.31 is less than the critical value of 1.645, H0 is rejected. There is enough evidence at the 10% level to reject the claim that there is no difference in the salaries earned by workers in the manufacturing and construction industries.
The Kruskal-Wallis Test § 11.3
The Kruskal-Wallis Test The Kruskal-Wallis test is a nonparametric test that can be used to determine whether three or more independent samples were selected from populations having the same distribution. The null and alternative hypotheses for the Kruskal-Wallis test are as follows. H0: There is no difference in the distribution of the populations. Ha: There is a difference in the distribution of the populations. Two conditions for using the Kruskal-Wallis test are that each sample must be randomly selected and the size of each sample must be at least 5. If these conditions are met, the test is approximated by a chi-square distribution with k – 1 degrees of freedom where k is the number of samples.
The Kruskal-Wallis Test Test Statistic for the Kruskal-WallisTest Given three or more independent samples, the test statistic H for the Kruskal-Wallis test is where k represent the number of samples, ni is the size of the ith sample, N is the sum of the sample sizes, and Ri is the sum of the ranks of the ith sample.
The Kruskal-Wallis Test Performing a Kruskal-Wallis Test In Words In Symbols • Identify the claim. State the null and alternative hypotheses. • Specify the level of significance. • Identify the degrees of freedom • Determine the critical value and the rejection region. State H0 and Ha. Identify . d.f. = k – 1 Use Table 6 in Appendix B. Continued.
The Kruskal-Wallis Test Performing a Kruskal-Wallis Test In Words In Symbols • Find the sum of the ranks for each sample. • List the combined data in ascending order. • Rank the combined data. • Calculate the test statistic. Continued.
The Kruskal-Wallis Test Performing a Kruskal-Wallis Test In Words In Symbols • Make a decision to reject or fail to reject the null hypothesis. • Interpret the decision in the context of the original claim. If H is in the rejection region, reject H0. Otherwise, fail to reject H0.
The Kruskal-Wallis Test Example: An insurance agent want to determine whether there is a difference in the annual premiums for home insurance in three states. He randomly selects homes from each state and records the annual premium for each state as shown below. At = 0.05, can he conclude that the distributions of the annul premiums are different? H0: There is no difference in the premiums in the three states. Ha: There is a difference in the premiums in the three states. (Claim) Continued.
The Kruskal-Wallis Test Example continued: This is a right-tailed test with = 0.05 and d.f. = k – 1 = 3 – 1 = 2. From Table 6, the critical value is χ02 = 5.991. The table shows the order and rank of the data. Continued.
The Kruskal-Wallis Test Example continued: The sum of the ranks for each sample is as follows. R1 = 1 + 7 + 8 + 9 + 10 + 11 = 46 R2 = 13+ 15 + 16 +17 + 18 + 19 + 20 = 118 R3 = 2 + 3 + 4 + 5 + 6 + 12 + 14 = 46 The test statistic is Because 12.55 is greater than the critical value of 5.991, reject H0. There is enough evidence at the 5% level to support the claim that the annual premiums are different in the three states.
Rank Correlation § 11.4
The Spearman Rank Correlation Coefficient The Spearman rank correlation coefficient rs is a measure of the strength of the relationship between two variables. The Spearman rank correlation coefficient is calculated using the ranks of paired sample data entries. The formula for the Spearman rank correlation coefficient is where n is the number of paired data entries, and d is the difference between the ranks of a paired data entry.
The Spearman Rank Correlation Coefficient The values of rsrange from 1 to 1, inclusive. If the ranks of corresponding data pairs are identical, rsis equal to +1. If the ranks are in “reverse” order, rsis equal to 1. If there is no relationship, rsis equal to 0. To determine whether the correlation between variables is significant, you can perform a hypothesis test for the population correlation coefficient ρs. The null and alternative hypotheses for this test are as follows. H0: ρs = 0 (There is no correlation between the variables.) Ha: ρs 0(There is a significant correlation between the variables.)
The Spearman Rank Correlation Coefficient Testing the Significance of the Correlation Coefficient In Words In Symbols • State the null and alternative hypotheses. • Specify the level of significance. • Determine the critical value. State H0 and Ha. Identify . Use Table 10 in Appendix B. Continued.
If is greater than the critical value, reject H0. Otherwise, fail to reject H0. The Spearman Rank Correlation Coefficient Testing the Significance of the Correlation Coefficient In Words In Symbols • Find the test statistic. • Make a decision to reject or fail to reject the null hypothesis. • Interpret the decision in the context of the original claim.
The Spearman Rank Correlation Coefficient Example: A Consumer Report article claims that the price of a portable CD player is related to its quality. To test this claim, you randomly select 11 portable CD players and determine the overall score and price of each. The overall score represents the error correction, locate speed, battery life, and headphone quality of a CD player. The results are in the table below. At = 0.01, can you conclude that there is a correlation between the overall score and the price? (Adapted from Consumer Reports) Continued.
The Spearman Rank Correlation Coefficient Example continued: H0: ρs = 0 (There is no correlation between score and price.) Ha: ρs 0(There is significant correlation between score and price.) (Claim) Continued.
The Spearman Rank Correlation Coefficient Example continued: From Table 10 with = 0.01 and n = 11, the critical value is 0.818. When n = 11 and ∑d 2 = 127, the test statistic is Because 0.423 < 0.818, we fail to reject H0. At the 1% level, there is not enough evidence to conclude that there is a significant correlation between the overall score of a CD player and its price.
The Runs Test § 11.5
There are 8 runs. The Runs Test for Randomness A run is a sequence of data having the same characteristic. Each run is preceded by and followed by data with a different characteristic or by no data at all. The number of data in a run is called the length of the run. Example: The gender of babies born in a hospital in one month was recorded in order of birth, where F represents a female and M represents a male. Determine the number of runs and the length of each run. F F F M M F F M F M M M F F F M M M M Length of runs: F F F M M F F M F M M M F F F M M M M 3 2 2 1 1 3 3 4
The Runs Test for Randomness The runs test for randomness is a nonparametric test that can be used to determine whether a sequence of sample data is random. Test Statistic for the RunsTest When n1 20 and n2 20, the test statistic for the runs test is G, the number of runs. When n1> 20 or n2 > 20, the test statistic for the runs test is where