Download
1 / 28
280 likes | 413 Views
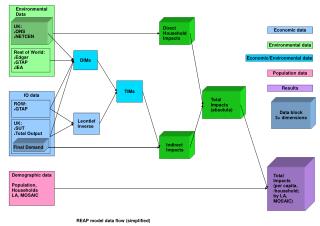
WIOD Conference , Wien, 26 th – 28 th May 2010. Linking Environmental Indicators with Economic Data (work in progress) Andreas Löschel Sascha Rexhäuser Michael Schymura Centre for European Economic Research, Mannheim Germany. WIOD Conference , Wien, 26 th – 28 th May 2010.

E N D
WIOD Conference, Wien, 26th – 28th May 2010 Linking Environmental Indicators with Economic Data(work in progress) Andreas Löschel Sascha Rexhäuser Michael Schymura Centre for European Economic Research, Mannheim Germany
WIOD Conference, Wien, 26th – 28th May 2010 Table of Contents Introduction Environmental Indicators Econometric Analysis Additional Indicators
WIOD Conference, Wien, 26th – 28th May 2010 1. Introduction • Work Package 7 of the WIOD Project: • Impact of globalization and structural change on environmental issues • Linking environmental indicators with economic data, using: • Panel data econometrics • Structural Decomposition Analysis (SDA)
WIOD Conference, Wien, 26th – 28th May 2010 1. Introduction • WP 7: SDA of indicators: “The change in each indicator is broken down into changes in its consistent parts ( • Effectsofchanges in productiontechnology, • Changes in tradepatterns • Changes in consumptionpatterns • Changes in environmental efficiencyatindustrylevel).“ Production based indicators: Current Presentation(Pollution Haven/Carbon Leakage) Consumption based indicators: Future Work(Ecological Footprint Analysis)
WIOD Conference, Wien, 26th – 28th May 2010 1. Introduction • On the search of adequate indicators: • The requirements of adequate environmental indicators crucially depend on the central question of research, and on • The method used. • General requirements of environmental indicators: • Unambiguous • Relevant • Measurable • Comparability • Free of value judgments • see Ebert & Welsch (2004) for a more detailed discussion
WIOD Conference, Wien, 26th – 28th May 2010 • 2. Environmental Indicators • Definitions • Requirements • Choice
WIOD Conference, Wien, 26th – 28th May 2010 2. Environmental Indicators • Definition: • Environmental indicators quantify and simplify information on environmental issues in order to make this information useable and publicly known (Hammond et al. 1995) • Types of indicators: • Pressure indicators(i.e. pollutant emissions to the atmosphere) • State indicators(i.e. pollutant concentration within the atmosphere) • Response indicators(i.e. energy intensities)
WIOD Conference, Wien, 26th – 28th May 2010 2. Environmental Indicators • Pressure Indicators: • We focus on pressure indicators because: • Theyservebest the criterion of policy relevance of environmental indicators and allow for a comparison of cross-country differences (Hammond et al. 1995) • Data are available from the WIOD input-output tables • The data directly attribute environmental damages to the production process
WIOD Conference, Wien, 26th – 28th May 2010 2. Environmental Indicators • Addressing the Question of Responsibility of Environmental Pressure: • Producer responsibility accounting(total emissions from resident institutional units) • Consumer responsibility accounting(total emissionsfromproduction - exports + imports) • Which accounting scheme is fair?We cannot answer this question precisely without relying on strong value judgments. Lenzen et al. (2007) offers an overview on this debate.
WIOD Conference, Wien, 26th – 28th May 2010 2. Environmental Indicators • Examplesofconsumerbasedindicators: • Ecologicalfootprint, carbonfootprint • Material Flow Analysis (MFA) (ecological „rucksack“ indicators) • Total Embodied Material Requirements (TEMR) and Total Material Consumption (TMC) • Life CycleAssessment (LCA) • Very popular in input-output frameworks
WIOD Conference, Wien, 26th – 28th May 2010 2. Environmental Indicators • Examples of producer based indicators: • Total emissions of pollutants (per GDP, or per industry output) • Carbonization index • (Energyintensity) • Popular in econometric analysis
WIOD Conference, Wien, 26th – 28th May 2010 2. Environmental Indicators • Discussion: • The choice of adequate indicators depends on the question of research (globalization and structural change impacts on the environment) and on: • The method used (SDA and panel data econometrics) • SDA: a change in an indicator will be broken down in its consisting parts. In order to reach the goals of WP 7, constructed indicators like the ecological footprint are not our preferred choice because we are interested in the impact of changes in world trade patterns!
WIOD Conference, Wien, 26th – 28th May 2010 • 3. Econometric Analysis • SDA • Problems and Discussion
WIOD Conference, Wien, 26th – 28th May 2010 3. Econometric Analysis • Introductory Comments: • WP 7 is interested in globalization, structural change and environmental issues. • The econometric implementation of the SDA allows to shed light on this central research question. • WIOD input-output tables provide sectoral disaggregated panel data for all countries.
WIOD Conference, Wien, 26th – 28th May 2010 3. Econometric Analysis • Structural Decomposition Analysis (econometric approach): • A change in an environmental pressure indicator will be decomposed in its: • Scale effect • Technique effect • Composition effect • Trade induced composition effect Source: own construction following Antweiler et al. (2001) and Cole & Elliot (2003)
WIOD Conference, Wien, 26th – 28th May 2010 3. Econometric Analysis • Scale Effect • How do total pollutant emissions change due to an increase in national economic activity? • Technique and composition effect are held constant. • The scale effect can be measured by using a country’s GDP, income or total output.
WIOD Conference, Wien, 26th – 28th May 2010 3. Econometric Analysis • Technique Effect • How do total pollutant emissions change due to a change in production technologies (i.e. triggered by environmental regulation)? • Composition and scale effect are held constant. • The technique effect is measured by most authors (Antweiler et al. 2001, Cole & Elliott 2003, and many more) by relying on the environmental Kuznets Curve relationship as a proxy for technological progress. • Thus, GDP per capita is a measure for the technique effect. • Remember that GDP is also used to measure the scale effect! • Thus, it is difficult to distinguish between scale and technique effect
WIOD Conference, Wien, 26th – 28th May 2010 3. Econometric Analysis • Composition Effect • How do total pollutant emissions change due to a shift in the mix of industries within an economy? • Technique and scale effect are held constant. • The composition effect can be measured by using capital-to-labor ratios as an indicator of the mix of dirty and clean industries within an economy. • This requires the assumption that capital-intensive industries have higher pollution or energy intensities.
WIOD Conference, Wien, 26th – 28th May 2010 3. Econometric Analysis • Trade Induced Composition Effect • How do total pollutant emissions change due to a shift in the mix of industries within an economy relative the world’s average? • Or in other words: is there an “outsourcing” of dirty industries to other countries (Pollution Haven Effect)? • Technique and scale effect are held constant. • The trade induced composition effect can be measured by using relative capital-to-labor ratios and relative incomes. • Why is relative income needed in addition to relative capital-to-labor ratios?(relative) income is a proxy-variable for environmental stringency, further details later!
WIOD Conference, Wien, 26th – 28th May 2010 3. Econometric Analysis • Problems of this approach 1/2: • The Kuznets Curve relationship is used here as a proxy for environmental stringency to measure the technique effect • The EKC method has some crucial requirements (Antweiler et al. 2001): • indicator (or pollutant) should be a by-product of goods production • by-product should vary across industries • shouldbesubjecttoregulation • well known abatement technologies for this special pollutant should be available • The pollutant shouldhave strong localeffects • Thus, possibleindicatorsare SO2 and NOx, but not CO2!
WIOD Conference, Wien, 26th – 28th May 2010 3. Econometric Analysis • Problems of this approach 2/2: • Endogeneity between: • The volume of trade flows and economic growth (GDP)(Frankel & Rose 2005, Frankel & Romer 1999) Use of instrument variables like distance, land area, etc. • The stringency of environmental regulation and trade flows (and political economy problems of trade policy)(Ederington & Minier 2003) time dummies and/or instrument variables for unemployment, union membership, etc.
WIOD Conference, Wien, 26th – 28th May 2010 3. Econometric Analysis • Short Summary: • The standard empirical pollution haven approach limits the choice of environmental indicators (local pollutants: SO2, NOx). • Problems for employing global pollutants (EKC relationship is an inappropriate measure of the technique effect). • Use of instrument variables necessary. • SDA is only useful by applying pressure indicators and the producer accounting principle.
WIOD Conference, Wien, 26th – 28th May 2010 • 4. Additional Indicators • Dynamics of Indicators
WIOD Conference, Wien, 26th – 28th May 2010 4. Additional Indicators • Mobility Indices • Here we want to shed some light on the time dynamics of environmental indicators. • Appropriate indicators for this analysis are for instance response indicators like relative energy intensities by industry or country. • This allows us to compare different countries or industries and sheds some light on technological progress.
WIOD Conference, Wien, 26th – 28th May 2010 4. Additional Indicators • The Shorrocks-Index • Introduced by Shorrocks (1979) • Needs rearranging of the data into transition matrices P (transition probabilities) for a transition from one time period to another. • Environmental indicators have to be classified into n groups (i.e. relative energy intensities from 90-80%, 80-70%, …) • The index for the amount of dynamics (not the direction) has the form: • A graphical illustration can be given by using Salter-Curves (Salter 1960) or Kernel-Density-Estimators.
WIOD Conference, Wien, 26th – 28th May 2010 5. Conclusion
WIOD Conference, Wien, 26th – 28th May 2010 5. Conclusion • Our work is focused on production based indicators. • We pronounced the preliminary state of this paper, final results will be presented in Amsterdam (December 2010). • Currently no data from the WIOD project. • SDA combined with mobility indices will give substantial insights into the effects of economic development on environmental indicators.
WIOD Conference, Wien, 26th – 28th May 2010 Thank you for your attention !