Environmental Indicators and Sustainability
250 likes | 690 Views
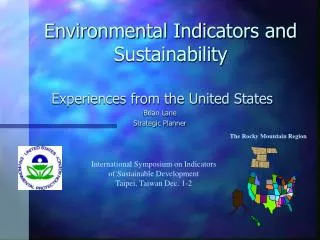
Environmental Indicators and Sustainability. The Rocky Mountain Region. Experiences from the United States Brian Lane Strategic Planner. International Symposium on Indicators of Sustainable Development Taipei, Taiwan Dec. 1-2. About the Rocky Mountain Region. Leading Environmental

Environmental Indicators and Sustainability
E N D
Presentation Transcript
Environmental Indicators and Sustainability The Rocky Mountain Region Experiences from the United States Brian Lane Strategic Planner International Symposium on Indicators of Sustainable Development Taipei, Taiwan Dec. 1-2
About the Rocky Mountain Region Leading Environmental Pressures: -Agriculture -Mining -Growth and Development A Few Facts About the Region: - 6 States - 27 Indian Tribes - Dry Climate - Rocky Mountains - Great Plains - Large % of Land Government Managed - Home of Many Natural Treasures...Yellowstone National Park
The Most Widely Used Indicator Framework Pressure State Response • Discharges • Emissions • Ambient conditions • Body Burden Uptake • Ecological Health & • Welfare • Regulatory Response • Actions by Regulated • Community Examples: • Pounds of toxics used • Vehicle miles traveled • Number of single use disposable goods purchased • Air quality (ppm) • Air quality • Tons recycled, incinerated or landfilled • Number of air permits • Automobiles inspected • Number of permitted landfills or incinerators
Agriculture Indicators of Environmental Pressures Leading Sources of Pollution LAKES & STREAMS % of threatened impaired miles
Indicators of Agency Response Hazardous Waste Site Cleanups
Pros of the Pressure-State-Response Model • Good framework for thinking about environmental causes • Categorizes indicators in a common sense, easy to understand way • Fits in well with the public policy process
Cons of the P-S-R Model • Some indicators don’t fit in this model • e.g., willingness to pay for environmentally safe products • Model is one-dimensional; the environment
Where U.S. is Headed with Indicators • Greater emphasis on results, on the environment • linking to environmental results • Shift from contraints (lack of data) to evaluation of success • Shift to local and state decision-making and accountability • Focus on managing and measuring in a place • Focus on longer-term sustainable indicators • Communicating with the Public
What is a Sustainable Indicator? • A measurable vision of a community’s future
How to Make a Perfect Sustainable Indicator Choose Something that the community cares deeply about
How to Make the Perfect Sustainable Indicator Measure what you want to be
Other considerations for selecting Sustainable Indicators • Relevant, understandable, and useable • Long-term view (25-50 years) • Show linkages • Used
Example of a Good Sustainable Indicator in Use: The Bernie Fowler's "Sneaker Index”
Bernie Fowler has a Goal GOAL: Restore Bernie's sneaker visibility to chest depth (57 to 63 inches). "Although this is not a scientific measure, it puts restoring the River on a human scale." Source: C. Bernard Fowler, 1992-1993 Chair of the Chesapeake Bay Commission; Kent Mountford, U.S. EPA Chesapeake Bay Program.
Sustainable Indicators Have Linkages Algae Growth River Visibility Impaired Underwater Seagrass Decline Excess Nutrients Oyster Population Decline Fast Growth and Development Decline in Oyster Fishing Industry/ Jobs Other related social factors -health -education -crime Land Use Trends
The “Sneaker Index” is Widely Known 11th Annual Patuxant River Wade, June 1998 Photograph Sneaker Index Score: 35.5 inches Goal: 57 to 63 inches
Examples of Current Work Community-based environmental protection programs (Chesapeake Bay..) Real time monitoring in major cities EMPACT Research and Development Environmental Monitoring and Mapping Outreach and Education Ways U.S. EPA is Pursuing Sustainable Indicators and Practices