Download
1 / 15
150 likes | 166 Views
This report presents findings on mesothelioma deaths in the US, including trends, geographic distribution, age groups, industry and occupation proportions, and anatomical sites. The report highlights the need for continued surveillance and preventive measures.

E N D
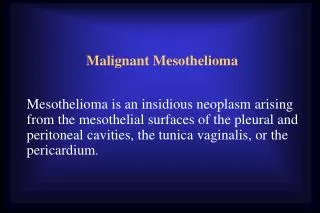
Surveillance of Mesothelioma at NIOSH WoRLD Surveillance Report http://www2a.cdc.gov/drds/WorldReportData/ The findings and conclusions in this report are those of the author and do not necessarily represent the views of the National Institute for Occupational Safety and Health.
Surveillance of Mesothelioma at NIOSH • Trends in overall deaths from mesothelioma in the US from 1999-2008 • by race and sex • Geographic distribution of deaths 1999-2007 • Age group distribution of deaths 1999-2008 • Years of potential life lost (YPLL) 1999-2007 • Industry & Occupation Proportionate Mortality Ratios (PMR) • Anatomical site 1999-2008
Mesothelioma Deaths 1999 – 2008 (ICD 10) 2704 2711 2657 2625 2606 2573 2588 2531 2509 Regression - F = 14.2; p < 0.01 (still rising) 2484 Pct Blk ♀ 4.2 4.3 3.0 3.9 4.2 3.7 4.2 4.8 4.0 4.1 19.7 19.3 19.4 19.4 19.0 19.4 20.6 19.4 20.4 20.6 1999 2002 2005 2008 Year
Five States with Most Deaths from Mesothelioma 2007 1999 2002 2004 Year
Number of Deaths by State, 1999-2007 NH- 125 712 VT- 50 213 105 66 MA- 719 514 396 594 RI- 118 53 109 1343 CT- 340 841 59 NJ- 1030 1575 219 152 136 DE- 95 1100 518 1146 141 DC- 23 246 248 191 672 387 MD- 462 248 2326 504 388 366 223 128 264 127 153 277 332 1183 405 44 1540 HI- 71
Number of Deaths by Age Groups 1999-2008 Percentages 0.09 0.3 1.4 4.7 14.8 28.8 38.0 11.9 9870 7487 Number of Deaths 3845 3098 1227 356 82 23 45-54 15-24 25-34 35-44 55-64 65-74 75-84 85+ Age Group
Decrease in Numbers of Deaths in ages 45-74 Over Time Percentage of Mesothelioma Deaths in the age group 45-74 1999 2002 2005 2008 Year
Increase in Numbers of Deaths in ages >74 Over Time Percentage of Mesothelioma Deaths in the age group >74 1999 2002 2005 2008 Year
Change in Mesothelioma Death Rates by Age Groups Over Time Ns=185, & 25988 Percentage of Mesothelioma Deaths by Age Groups 1999 2002 2005 2008 Year
Years of Potential Life Lost (1999-2007) • Based on 23,277 deaths • YPLL range 13.5 – 14.1 per death • Average YPLL 13.8 per death • Total YPLL 321,845 • 1999 – 2007; Thus YPLL/year is 35,760
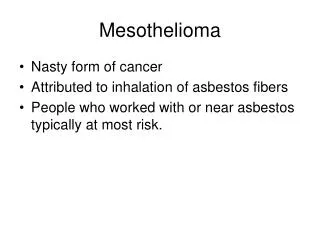
PMRs by Industry & Occupation • Industry • Ship/Boat building and repair 6.0 (2.4-12.3) • Industrial chemicals 4.8 (2.9-7.5) • Petroleum refining 3.8 (1.2-8.9) • Electric light and power 3.1 (1.5-5.7) • Construction 1.6 (1.2-1.9) • Occupation • Plumbers/pipe- & steam-fitters 4.8 (2.8-7.5) • Mechanical engineers 3.0 (1.1-6.6) • Electricians 2.4 (1.3-4.2) • Teachers (elementary school) 2.1 (1.1-3.6)
Anatomical Site (1999-2008) • Data derived from death certificates • Data by anatomical site • Pleura 8.1% • Peritoneum 3.7% • Other 13.6% • Unspecified 75.7% • Data frequently missing (similarly occupation) • Case for electronic health records
Summary • There were almost 26,000 MM deaths among U.S. residents aged >15 years old between 1999 and 2008 and ~350,000 PYLL. • During the same period ~20% of deaths were among women and ~4% were Black. • More than half of which were from 9 States: CA > PA > FL > NY > TX > IL > OH > NJ > MI • Construction accounted for 15% of decedents
WoRLD Surveillance Report • Asbestosis • Coal workers’ pneumoconiosis • Silicosis • Byssinosis • Unspecified and other Pneumoconioses • All pneumoconioses • Malignant mesothelioma • Hypersensitivity pneumonitis • Asthma • Chronic obstructive pulmonary disease • Respiratory conditions due to toxic agents • Respiratory tuberculosis • Lung cancer • Other interstitial pulmonary diseases • Pneumonia and influenza • Various work-related respiratory conditions • Smoking prevalence by industry and occupation
Acknowledgement Contributing Agencies NIOSH Staff Jacek Mazurek Patti Schleiff John Wood Eileen Storey Ki-moon Bang Anita Wolfe • Bureau of Labor Statistics • Social Security Admin. • Dept. Labor • OSHA/MSHA • CDC • National Center for Health Stats • CWXSP – NIOSH