Download
1 / 26
270 likes | 432 Views
Research & the Role of Statistics Variables & Levels of Measurement. The Structure of Research & The Role of Statistics. Begin with Broad Questions. Most social research originates from some general problem or question Curious/troubled about some aspect of society.

E N D
Research & the Role of Statistics Variables & Levels of Measurement
Begin with Broad Questions • Most social research originates from some general problem or question • Curious/troubled about some aspect of society
Begin with Broad Questions • Example: What influences how a child does in school? • General question that can’t be adequately addressed by 1 study
Narrow Down, Focus In • Next, we come up with a more specific research question • one we can realistically address • Here, a review of the scientific literature can serve as a guide • Tells you what other researchers have found • Gives “bearing” to your research study
Narrow Down, Focus In • Example: What is the relationship between family structure and school performance?
Narrow Down, Focus In Also can be stated as a causal theory – • an explanation of the relationships b/t phenomena • Example: Children with more parental support/guidance will tend to perform better in school.
Theory • Children with more parental support/guidance will tend to perform better in school. • Underlined terms are concepts – abstract ideas • concepts are ambiguous
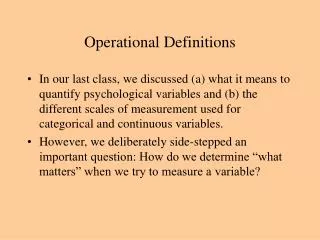
Operationalize • operationalize – define a concept in a way that it can be measured
Operationalize • Put another way: turning concepts into… • variables • something measurable • any trait that can change values from case to case • Some concepts easier to operationalize than others • Examples: • Parental support/guidance # parents in home (1 or 2) • School performance GPA (1 to 4) • OTHER OPERATIONALIZATIONS?
Group Exercise: “Operationalization” • Working with the person (or 2) closest to you, come up with variables (something measurable) that could be used as indicators of the following concepts: • Healthy lifestyle (of an individual) • Economic health of Duluth • Success of UMD grads
Operationalize • Hypothesis: • derived from theory • statement about a relationship between variables • therefore: • it is more specific/exact than a theory • it is testable
Operationalize • Hypothesis example: • Students living in homes with 2 parents/guardians will tend to have higher GPA’s than students from 1-parent households. • Independent variable (x) • cause (i.e., # of parents) • Dependent variable (y) • effect or outcome measure (GPA) • x y
Observe • Observations allow for hypothesis testing • Science is a systematic method for explaining empirical phenomena • Empirical means measurable & observable
Observe • Research methods are the tools used at this stage • How are data to be sampled & gathered? • Lab experiment? • Survey? • Analysis of existing data? • Observations produce data • Observation vs. Anecdote
Analyze Data & Reach Conclusions • Our focus in this class: • hypotheses are tested by comparing observations to theoretical predictions • Statistical procedures give the ability to tell: • whether the data support our hypotheses • & by extension, whether our theory is supported
Analyze Data & Reach Conclusions • Two classes of statistical techniques: • Descriptive – used to summarize/organize/ describe data. • Example: What is the avg. # of hours per week people spend on face book?
Analyze Data & Reach Conclusions • Two classes of statistical techniques: 2.Inferential – used to generalize findings from a sample to a population • Example: polling just a few hundred voters to predict how a presidential election will turn out.
Generalize Back to Questions • What do the results tell us about our original broader question? • Determined by: • How theories are operationalized • The nature of the observed sample
Variables 101 • VARIABLES are any trait that can change values from case to case • Attribute – specific value on a variable • Example: sex has 2 attributes, male & female • Variables ALWAYS should: • beexhaustive – variables should consist of all possible values/attributes • have mutually exclusive attributes; no case should be able to have 2 attributes simultaneously
Levels of Measurement • Nominal – mutually exclusive & exhaustive categories that cannot be meaningfully ordered (e.g., sex, religion, political affiliation) • Categories need to be relatively homogenous
Levels of Measurement Scales for Measuring Students’ Living Arrangements
Levels of Measurement 2. Ordinal – categories can be ranked in addition to being categorized. • Example: “I would rather get beat with a lead pipe than attend this class.” • 1 = strongly disagree • 2 = disagree • 3 = neutral • 4 = agree • 5 = strongly agree
Levels of measurement • What’s Wrong with This Question: • How long have you been attending UMD? • 1 to 11 months • 1 to 2 years • 2 to 3 years • 3 to 4 years • 5 or more years
Levels of measurement 3. Interval-Ratio – categorical units are equal • Examples: prison sentence in months, population of Duluth, age • This level permits all mathematical operations (e.g., someone who is 34 is twice as old as one 17) • Pointy headed issue • Interval = no meaningful zero point • Ratio = meaningful zero point • DOESN’T MATTER ONE BIT FOR DATA ANALYSIS • SPSS calls both interval and ratio variables “SCALE”
Group Exercise • Research Hypothesis = Males who experience hair loss become more likely to experience depression. • What is the IV? What is the level of measurement for this variable? • What is the DV? Operationalize the DV so that it is measured at the nominal, ordinal, and interval/ratio levels.