Download
1 / 13
130 likes | 230 Views
Study on RT focusing periods, cavity types, emittance analysis, and cavities parameters in different scenarios for particle accelerator applications.

E N D
Front End Simulation in different scenarios(continuation)V.N. Aseev (FNAL) P.N. Ostroumov (ANL)September 13, 2007
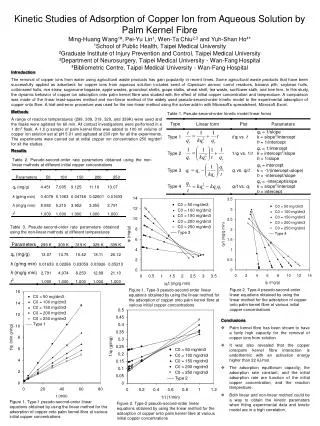
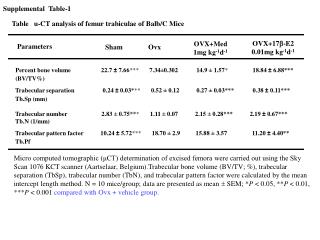
Figure 9. Transverse rms emittance. I=15 mA, 500K particles. Figure 10. Transverse emittance containing 99.5% particles I=15 mA, 500K particles. Figure 12. Longitudinal emittance containing 99.5% particles I=15 mA, 500K particles. Figure 11. Longitudinal rms emittance. I=15 mA, 500K particles.
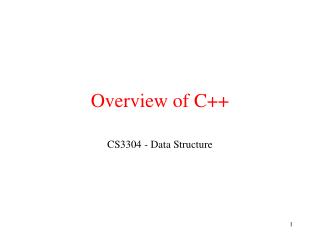
I=15mA Table 2: Phase advances in X,Y, Z planes.
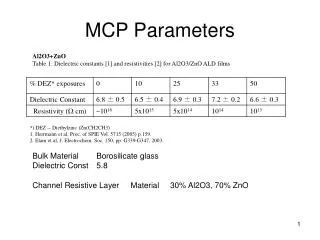
Ncav Type f, MGz Rap, cm Vcav, MV phase, deg beta_in Wgain, MV 1 81 325.0 1.20 0.0813 -90.00 0.073034 0.0013 2 81 325.0 1.20 0.0825 -90.00 0.073050 0.0012 3 1 325.0 0.90 0.1806 -90.00 0.073226 0.0122 4 2 325.0 0.90 0.2572 -50.00 0.075675 0.1727 5 3 325.0 0.90 0.2787 -50.00 0.078246 0.1876 6 4 325.0 0.90 0.3242 -50.00 0.081137 0.2185 7 5 325.0 0.90 0.3754 -50.00 0.084416 0.2576 8 5 325.0 0.90 0.4340 -45.00 0.088312 0.3196 9 8 325.0 0.90 0.5431 -45.00 0.093066 0.4100 10 8 325.0 0.90 0.5860 -40.00 0.098181 0.4658 11 8 325.0 0.90 0.6365 -35.00 0.103700 0.5314 12 11 325.0 0.90 0.6857 -33.00 0.109473 0.5880 13 11 325.0 0.90 0.7226 -33.00 0.115199 0.6158 14 11 325.0 0.90 0.8014 -33.00 0.121196 0.6800 15 14 325.0 0.90 0.9248 -33.00 0.127792 0.7897 16 14 325.0 0.90 0.9067 -33.00 0.133901 0.7705 17 16 325.0 0.90 0.6215 -33.00 0.137914 0.5269 18 16 325.0 0.90 0.9941 -40.00 0.143634 0.7794 19 22 325.0 1.50 1.2388 -30.00 0.151230 1.0873 20 22 325.0 1.50 1.2081 -30.00 0.158237 1.0561 21 22 325.0 1.50 1.2733 -30.00 0.165271 1.1120 22 22 325.0 1.50 1.3263 -30.00 0.172257 1.1565 23 22 325.0 1.50 1.3684 -30.00 0.179153 1.1930 24 22 325.0 1.50 1.4010 -30.00 0.185912 1.2192 25 22 325.0 1.50 1.4256 -30.00 0.192523 1.2411 26 22 325.0 1.50 1.4437 -30.00 0.198962 1.2554 27 22 325.0 1.50 1.4563 -30.00 0.205222 1.2649 Table 3: Cavities parameters of the MEBT, RT, and 1st SSR cryomodule