Download
1 / 40
400 likes | 557 Views
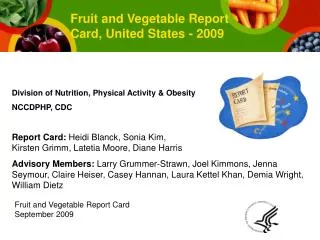
Fruit and Vegetable Report Card, United States - 2009. Nutrition Research and Surveillance Division of Nutrition, Physical Activity & Obesity NCCDPHP, CDC Report Card: Heidi Blanck, Sonia Kim, Kirsten Grimm, Latetia Moore, Diane Harris

E N D
Fruit and Vegetable Report Card, United States - 2009 Nutrition Research and Surveillance Division of Nutrition, Physical Activity & Obesity NCCDPHP, CDC Report Card: Heidi Blanck, Sonia Kim, Kirsten Grimm, Latetia Moore, Diane Harris Advisory Members: Larry Grummer-Strawn, Joel Kimmons, Jenna Seymour, Claire Heiser, Casey Hannan, Laura Kettel Khan, William Dietz ASTPHND State TeleconferenceFruit and Vegetable Report Card June 2, 2009
Fruit and Vegetable Report Card, United States - 2009 • General information • Outcome indicators • Process indicators • What next
Fruit and Vegetable Report Card Fruit and Vegetable Report Card indicators can be used to: • Monitor progress and celebrate state successes. • Identify opportunities for growth and improvement in environmental and policy supports for making F&V an easier healthy choice within each state.
Approaches for Increasing supportive environments for F&V Identify Key F&V Data • Individual • FV Consumption • Physical environment • Schools • Communities • Macro-level environments • Policy actions Story, M., K. M. Kaphingst, et al. (2008). "Creating healthy food and eating environments: policy and environmental approaches." Annual Rev Public Health29: 253-72, Figure 1.
Fruit and Vegetable Report Card Reports information for each state on “outcome” and “process” indicators. • The outcome indicators profile the extent to which adults & adolescents in a state meet HP2010 goals. • The process indicators measure elements of supportive policies and environments for F&V consumption. • Each indicator can be measured in the majority of states, allowing easy state-by-state comparisons. • The indicators show where a state is at currently and where more work is needed. • Identify success: publish every other year – 2009, 2011, 2013
Process: Fruit and Vegetable Report Card • Fall 2008 – Brainstorming among Internal F&V Team/Workgroup members • Spring 2009 – Larger Division Management and Leadership meeting • Spring 2009 – Dr. Dietz attends PBH F&V Alliance Meeting, shares concept • April 28, 2009 – SRC Sustainable Food System Workgroup Teleconference • June 2, 2009 – ASTPHND, State F&V Nutrition Coordinators Call • July, 2009 – Put into CDC Clearance • September 2009 – Released as part of MoreMatters Promotion Month (Sept 10, 2009 DNPAO Teleconference)
Fruit and Vegetable Report Card Criteria for inclusion included: • Indicator promising area for SE model approach for F&V • Data measurable, available for most states • Data from reputable source: .gov, .org, .edu; transparent methodology in obtaining information • When possible data allows for density and percentages for comparability among states of different geographic and population size • High bar to be counted
Fruit and Vegetable Report Card DRAFT Outcome Indicators Monitor the Healthy People 2010 F&V objectives >=2 fruit daily >=3 vegetables daily
Fruit and Vegetable Report Card DRAFT Process Indicators Monitor different types of support for F&V in 6 difference strategic areas: Land Acreage Food Policy Council Farmers Markets Healthy Food Retail(Grocery stores, corner stores, ethnic markets/stores, etc…) Farm to School School Food Environment
Fruit and Vegetable Report Card Questions for Teleconference Participants to Consider: • Indicator (is it the right concept) • DRAFT list started with ~25 indicators, brought down to these few • Metric (is this a helpful way to represent the data for your work in improving F&V) • Density and percentages allow for comparability among states of different geographic and population size • Data source (are you aware of another source that has state specific data) • Source needs to be transparent, use active solicitation if possible
Process Indicator 2008 Data Compilation in process
Questions/Comments Indicators we should consider that are not included in this version? Note: Initial list included - Gardens (community, school) USDA Programs (WIC FM, Srs FM) Fresh FV Program CSA programs
Outcome Indicator • Key questions: • Is it helpful to have separate indicators? • Is it helpful to have the combined indicator? Note: usual 5Aday measure is about 24% vs. 14% for Both
Outcome Indicator • Key questions: • Is it helpful to have separate indicators? • Is it helpful to have the combined indicator? Note: usual 5Aday measure is ~21% for Both
Process Indicator • Key questions: • Is it helpful to have both state and local council? • Is it helpful to have the number as a metric? • Would it be helpful to denote if state is regional council member?
Process Indicator • Key questions: • How strong should the support be to count as a policy? • a) Is it useful to have a minimum level of support to count a policy?
Process Indicator Key Question State data already available online; is it helpful to have as part of F&V report card? 2008 Data Compilation in process
Process Indicator Key Question Is this a more useful indicator than the FV Sold indicator? Data compilation in process
Process Indicator Key questions: ** Policies include: Grants, loans, tax breaks. ** Policies provide for: a) the building and/or placement of new food retail outlets b) renovation and equipment upgrades of existing food retail outlets c) increases in and promotion of healthy food options available at food retail outlets 1) Is anything missing?
Process Indicator Key questions: Are measures at the zip code level helpful (versus census tracts, block groups, or other standard geographical area)? Should areas be limited to residential areas only?
Process Indicators Land Acreage Food Policy Council Farm to School School Food Environment Farmers Markets Healthy Food Retail GAPS No worksite No childcare No medical care Story, M., K. M. Kaphingst, et al. (2008). "Creating healthy food and eating environments: policy and environmental approaches." Annual Rev Public Health29: 253-72, Figure 1.
Report Card Calls to Action • Select priority problems to work on • Advocate for improvement • Use as a baseline for program evaluation • Evaluate progress over time • Broaden community support • Strengthen legislative action and support • Incorporate into state plans CDC plans to produce the F&V Report Card every two years for September F&V More Matters Month
Process: Fruit and Vegetable Report Card • June 2, 2009 – ASTPHND, State F&V Nutrition Coordinators Call Send Comments to Heidi Blanck at hblanck@cdc.gov by Wednesday June 10th • July, 2009 – Put into CDC Clearance • September 2009 – Released as part of MoreMatters Promotion Month (Sept 10, 2009 DNPAO Teleconference)
F&V Report Card – United States, 2009 How can you help? NOW • Provide feedback prior to launch • Identify errors and omissions FUTURE • Provide feedback on use • Suggest new indicators that meet criteria • Create awareness within your states among partners • Local business, coalitions & advocates • Policy makers • Media • Education • Agriculture • Public Health professionals
Goal: The F&V Report Card can be used tocommunicate the need for coordinated efforts to improve nutrition across the food system so that all Americans can make healthy choices.
THANK YOU! Comments to: HBlanck@cdc.gov www.cdc.gov/nccdphp/dnpa www.fruitsandveggiesmatter.gov