Expression Data Analysis
Explore the revolution of omics data analysis methods including expression data analysis, proteomics, ChIP-chip, epigenetics, and metabolomics. Learn how these methods are used to study gene interactions, protein analysis, DNA-protein interactions, changes in gene expression, and cellular processes.

Expression Data Analysis
E N D
Presentation Transcript
Expression Data Analysis Roy Williams PhD Sanford | Burnham Medical Research Institute
Omics Biology Methods • Expression data mRNA/ MicroRNA (microarrays, RNA-seq): A tool for studying how large numbers of genes interact with each other and how a cell's regulatory networks control vast batteries of genes simultaneously • Proteomics: the branch of genetics that studies the full set of proteins encoded by a genome • chIP-chip, chIP-seq: ChIP-on-chip is used to investigate interactions between proteins and DNA in vivo • Epigenetics: epigenetics is the study of changes in phenotype (appearance) or gene expression caused by mechanisms other than changes in the underlying DNA sequence; e.g. bp methylation. • Metabolomics: systematic study of the unique chemical fingerprints (metabolite profiles) that specific cellular processes leave behind
Omics Workflows Converge Acquire Peptide Sequence MS Spectral counts, Align Interpret Data Statistical test, Visualization, Pathway Analysis Acquire Sequence Generate Bases, FASTQ Count Reads Align, Annotate Hybridize Array Scan Array Determine Intensity
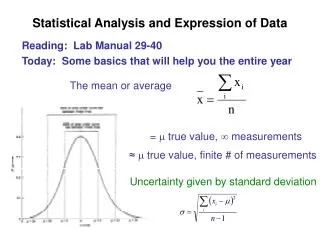
Measuring Gene Expression Idea: measure the amount ofmRNAto see whichgenesare beingexpressedin (used by) the cell. Measuringproteinwould be more direct, but is currently harder.
Assumption of microarray/RNA-seq technology • Use mRNA transcript abundance level as a measure of expression for the corresponding gene • Proportional to degree of gene expression
How to measure RNA abundance • RNA-seq: short reads from SOLiD, ion torrent, 454, Solexa. Align, count, normalize reads to length of gene (RPKM). • Illumina bead array – highly redundant oligo array (also Affymetrix, NimbleGen) • Spotted 2-colour array (very long cDNA; low redundancy) • SAGE (random Sanger sequencing of cDNA library)
The Illumina Beadarray Technology • Highly redundant ~50 copies of a bead • 60mer oligos • Absolute expression • Each array is deconvoluted using a color coding tag system • Human, Mouse, Rat, Custom
Affymetrix Technology • Highly redundant (~25 short oligos per gene) • Absolute expression • PM-MM oligo system valuable for cross hybe detection • Human, Mouse, E. coli, Yeast…….. • Affy and Illumina arrays have been systematically compared
Spotted Arrays • Low redundancy • cDNA and oligo • Two dyes Cy5/Cy3 • Relative expression • Cost and custom
Microarrays in action off on
The Application of Expression Studies • Differential gene expression between two (or more) sample types • Similar gene expression across treatments • Tumour sub-class identification using gene expression profiles • Identification of “marker” genes that characterize different cell types • Identification of genes associated with clinical outcomes (e.g. survival)
Analysis Software forMicroarray and RNA-seq data • Free Software – GenePattern / IGV -- powerful, many plug-in packages and pipelines -- good video examples/tutorials • GeneSpring GX11 (commercial, 1 public copy) • Partek (commercial) • GE-Workbench (free, nice workflows) • R-Bioconductor (free, with guidance) • Cytoscape, GSEA – for pathway visualisation • IPA, NextBio, GeneGo <= Burnham subscriptions!
Log Transformed Data Normal distribution Skewed raw 2/2 = 1 log2(1) = 0 4/1=4 log2(4) = +2 ¼=0.25 log2(0.25) = -2 Transformation often performed before normalisation
BOXPLOT REPRESENTATION OF DATA SPREAD After QC for low confidence genes (P<0.99) Note: ~50 replicate beads per array Outliers SIGNAL INTENSITY 75% quartile Median 25% quartile BAD CHIP CHIP NUMBER
The effect of quantiles Normalisation on the filtered 36 data sets IMPORTANT: use non-linear normalisation >library(affy) >Qdata <- normalize.quantiles(Rawdata) All same range
Data Analysis Examples • 1# Illumina arrays with GeneSpring GX11 • 2# Affymetrix data, with a GenePattern module • Import, Quality Control, normalize • Detect differentially expressed genes • Pathway analysis
Illumina Analysis Workflow Genome Studio Application: process binary .idat files to txt Normalisation here is optional Check array hybridisation quality Direct Export file as “sample probe profile” Import into GENESPRING GX11
GeneSpring GX11 features • Guided workflows • Pathways • GSEA • IPA integration • Ontologies • MySQL • R script API
Which types of genes are enriched in a cluster? Our Cell cycle • Idea: Compare your cluster of genes with lists of genes with common properties (function, expression, location). • Find how many genes overlap between your cluster and a gene list. • Calculate the probability of obtaining the overlap by chance. This measures if the enrichment is significant. • This analysis provides an unbiased way of detecting connections between expression and function. 0 15000 25 7 GeneOntology Cell cycle
Completed Analysis Data genelists Pathways
Send results to next module Viewer module
Outputs ranked list of genes List of Marker genes can be Filtered and exported
Cluster FAQ: what do the hierarchy of black lines making up the tree mean, How do I interpret them? • Answer: The vertical black lines joining related genes together represent the correlation distance between those genes. Hierarchical clustering programs first join the two genes with the highest correlation. • http://llama.mshri.on.ca/funcassociate/ (converting geneID to gene names)
FAQ: How to find transcriptional regulatory networks from expression data? • Reverse engineering using gene expression data • If a gene is upregulated following an increased production of a transcription factor, or down-regulated following a knockout of a transcription factor, a regulatory interaction between the two is inferred • Inferring networks by predicting cis-regulatory elements • Known TFBS used to make inferences about regulatory interactions. The set of genes which are predicted to have a binding site are hypothesized to be regulated by the corresponding transcription factor.
FAQ: How to find transcriptional regulatory networks from expression data? • ARACNe (Algorithm for the Reconstruction of Accurate Cellular Networks) (Basso 2005, Margolin 2006a, 2006b). • Known transcription factors are given as hub genes to seed the system ARACNe output in Cytoscape
Similarities FAQ: GeneGo - IPA – NextBio; similarities and differences? How do I get an account? • All commercial off site tools – microarray/NGS data • Upload your gene lists to analysis tool • Tool detects networks/ontologies in your data • They can give different results (!) • Allows you to look for connections between genes and drugs/small molecules/diseases • Focused on Man and Mouse
FAQ: GeneGo - IPA – NextBio; similarities and differences? Differences • IPA: most user friendly interface • NextBio • Based on experimental analysis and comparisons • Reanalysis of public data and made platform independent • GeneGo: • More refined classification of diseases/networks • 3 click analysis gives a nice report • 50 PhD curators, more journals, data QC higher
NextBio • Compares your Genelists to the NextBio database • Can reveal unexpected similarities between datasets • Has a very good literature database connected to the results • Contains data from model organisms