Download
1 / 48
480 likes | 702 Views
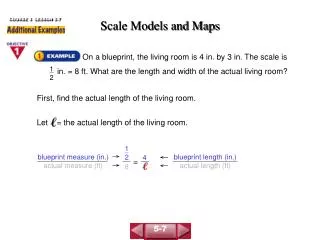
SCALE, SCALE MODELS, AND SKELETONS Copeland APHG 2010-11. SCALE: a comparison of distances on a map to distances on the earth. METHODS OF PORTRAYING SCALE ON A MAP: Graphic Scale = scale bar Verbal Scale = written statement Fractional Scale = representative fraction.

E N D
SCALE, SCALE MODELS, AND SKELETONS Copeland APHG 2010-11
SCALE:a comparison of distances on a map to distances on the earth • METHODS OF PORTRAYING SCALE ON A MAP: • Graphic Scale = scale bar • Verbal Scale = written statement • Fractional Scale = representative fraction
What kind of scale? “One inch to 5 miles” Verbal scale
What kind of scale? 1:316,800 or 1/316,800 Fractional Scale
What kind of scale? Graphic Scale
These mushroom spores are too small to see, so we put them under a MICROSCOPE. When we can see them, we can study them.
This planet is too big to see, so we put it under a MACROSCOPE. When we can see it, we can study it.
“Some things are very tiny, and we must use complex electric and optical means (e.g., a microscope) to enlarge them so as to understand their configuration and structural relationships. In contrast, geographical things are so extensive that we must somehow reduce them to bring them into view.” - Arthur Robinson, cartographer
We need to use our . . . MAPS as MACROSCOPES. . . to help us think critically about problems and “problem spots” on the world stage.
Scale is Critical to Critical Thinking • Using reason to decide what to believe or do. • Assessing the authenticity, accuracy, or worth of knowledge claims and arguments. • Applying careful, precise, persistent and objective analysis of any knowledge claim or belief to judge its validity.
Scale and its Two Meanings • First: Scale is the distance on a map compared to the distance on the Earth *Large scale maps are enlarged maps to show cities and sometimes small towns (zoomed in). Small scale maps are maps shrunken down only to show countries and continents (zoomed out). The town might be on a scale of 1:10,000 and the world map might be on a scale of 1:100,000,000 • Second: Territorial extent of something * We use the second of the two meanings quite often in this class. By observing scale, we can study a single phenomena across different scales in order to see how what is happening at the global scale affects the localities and how what is happening locally affects the globe.
Cobb County, GA State of Georgia Median Household Income - $47,469 Over $50,000 • Forsyth: $84,567 • Fayette: $77,491 • Oconee: $74,630 • Columbia: $68,986 • Cherokee: $66,972 • Henry: $63,892 • Paulding: $63,663 • Harris: $63,351 • Cobb: $62,893 • Coweta: $59,848 • Gwinnett: $58,732 • Bryan: $58,092 • Lee: $57,044 • Fulton: $56,313 • Pike: $55,674 • Effingham: $54,678 • Monroe: $53,805 • Dawson: $53,215 • Rockdale: $51,265 • Douglas: $50,798 • Pickens: $50,790 • Houston: $50,733 • Jackson: $50,591 • Walton: $50,321 • Newton: $50,137 • DeKalb: $50,092
ETHNIC CONFLICT AND THE CONCEPT OF SCALE • Ethnic conflicts abound on the world political map. To understand them, we use a set of concepts: • minorities • majorities • We count and we quantify. • Because we quantify we think our analysis is objective. • Because we are objective, we reach unbiased conclusions.
What is a minority? “the smaller in number of two groups constituting a whole” - Merriam-Webster OnLine
SERENDIB CEYLON SRI LANKA
Sri Lanka • Formerly Ceylon, now an island Republic in the Indian Ocean just southeast of India • A British colony since 1796 became independent in 1948 • Marked by hostility among its ethnic groups
With about three-quarters of the population, what ethnic group in Sri Lanka is in the majority? • Moors • Sinhalese • Tamils • Burghers
SINHALESE Language = Sinhala Buddhist Religion =
With about one-fifth of the population, what ethnic group in Sri Lanka comprises the largest minority? • Moors • Sinhalese • Tamils • Burghers
TAMILS Language = Tamil Religion = Hindu
Leaves from Pipul tree are Buddhist symbols Lion – Kingdom of Kandy Sinhalese Green – Muslim Orange - Tamil
Ethnic comes from the Greek word ethnos meaning “nation” or “life way.” Yet, in our current lexicon we use it not as a synonym for national, but almost as an affront. Within nations exist ethnic minorities. Sri Lanka: 4 million Tamils Sri Lanka: 15 million Sinhalese
Ethnic Geography: Who’s the minority? Sri Lanka: 4 million Tamils Sri Lanka: 15 million Sinhalese India: 63 million Tamils India: no Sinhalese
Pattern Probing Using Scale • If we are close, Then, we see lots of detail, but may not recognize overall patterns. • If we are far away, Then we miss lots of detail, but recognize overall patterns.