Download
1 / 56
560 likes | 798 Views
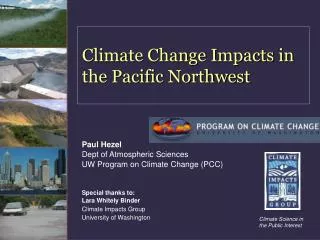
Climate Science in the Public Interest. Climate Change Impacts in the Pacific Northwest. Paul Hezel Dept of Atmospheric Sciences UW Program on Climate Change (PCC) Special thanks to: Lara Whitely Binder Climate Impacts Group University of Washington. Take Home Messages.

E N D
Climate Science in the Public Interest Climate Change Impacts in the Pacific Northwest Paul Hezel Dept of Atmospheric Sciences UW Program on Climate Change (PCC) Special thanks to: Lara Whitely Binder Climate Impacts Group University of Washington
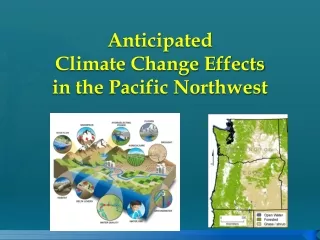
Take Home Messages • Global and regional climate is changing and the human influence has emerged from the “noise” • These changes are expected to accelerate in the coming decades • Changes in snowpack and streamflow caused by rising temperatures will have important consequences for resources across the PNW • Local, State and Regional Initiatives are starting to address mitigation and adaptation (but there’s a lot of work to do…)
Rapid increases in greenhouse gases are changing this natural balance Greenhouse gases (water vapor, CO2, CH4, N2O) play a critical role in determining global temperature
Arctic Sea Ice Minimums 2007 2008
How different were 2007/2008? 2007 2008
How different were 2007/2008? 2007 2008
Average global temperature increase Warming since the 1950s very likely (>90% chance) due to human increases in GHG. (IPCC AR4)
+35% Figure source: IPCC 2007
How do we know it’s greenhouse gases?Require GHG forcing to explain observed temperature rise (with GHG)(without GHG)IPCC 2007
Global Climate Change… • Climate is changing • Human activity is responsible • Greenhouse gases warm the planet • We are increasing the greenhouse gas concentration • Have these atmospheric concentrations been higher? Yes, but not in at least 640,000 years (and for CO2, likely not for ~4 million years)
Global Climate Change… • Current social, economic, and cultural systems based on a steady climate withknown variability … and therein lie the challenges So where are we heading?
Scenarios Projectedwarming Projected 21st century Global Warming IPCC “best estimate” range of global-scale warming by the 2090s: 3.2°F-7.2°F Warming in the next few decades largely driven by current and near-termatmospheric GHG concentrations
Risks of future climate change Source: IPCC 2001
Possible Threats and Global impacts… Increase of extreme weather events Sea level rise / Flooding of coastal communities Ocean acidification ‘Wet gets wetter, dry gets drier’ Loss of polar ice caps (esp Arctic) Feedbacks within the climate system can amplify changes Ecosystem change Spread of diseases
What climate signals are observed in PNW? • Temperatures • Glaciers/Snowpack • Streamflow • Frost days Signal is complicated by natural climate oscillations. ENSO/PDO.
Nearly every glacier in the Cascades and Olympics has retreated during the past 50-150 years South Cascade Glacier, 1928 (top) and 2000 (right) Photos courtesy of Dr. Ed Josberger, USGS Glacier Group, Tacoma, WA
Temperature Trends (°F per century), since 1920 DecreaseIncrease DecreaseIncrease CoolerWarmer 3.6 °F 2.7 °F 1.8 °F April 1 snowpack has decreased throughout the PNW with losses of 30-60% at many individual stations (1950-2000) 0.9 °F Similar snowpack declines are seen throughout the western United States Mote 2003(a), updated Key Trends in PNW Climate Average annual temperature increased+1.5F in the PNW during the 20th century
Trends in Spring Runoff Peak of spring runoff is moving earlier into the spring throughout western U.S. and Canada Stewart et al. 2005 Stewart I.T., Cayan D.R., Dettinger M.D., 2005: Changes toward earlier streamflow timing across western North America, Journal of Climate, 18(8):1136-1155.
Fewer Frost Days in the Late 20th Century Largest trends observed in the PNW; most of the trend driven by decline in spring frost days G. A. Meehl, C.Tebaldi and D. Nychka (2004) Changes in frost days in simulations of 21st century climate. Climate Dynamics, Vol. 23, No. 5, pp. 495-511
Attribution • Are these changes due entirely to climate change? NO, modes of natural variability have a role in these trends (e.g., El Niño, PDO) • Are these changes due entirely to natural climate variability? NO, natural variability cannot explain all of the trends …a climate change signal appears to be emerging
Changes to come… UW Climate Impacts Group
14.4°F +5.9ºF (2.8-9.7ºF) 10.8°F +3.5ºF (1.6-5.2ºF) 7.2°F °C +2.2ºF (1.1-3.4ºF) 3.6°F 0°F Changes relative to 1970-1999 Projected Increases in PNW Temp • Rate of change expected to be 3x greater • Warming expected in all seasons, greatest in summer
Modest Changes in PNW Precipitation Modest increases (1-2%) in annual average precipitation Most of the increase comes in the winter months (but in what intensity?) Projected increase in average does not exceed 20th century variability Note: there is high confidence in projected temp changes, less in precipitation changes
Lower Spring Snowpack Spring snowpack is projected to decline as more winter precipitation falls as rain rather than snow, especially in warmer mid-elevation basinsSnowpack will melt earlier with warmer spring temperatures +4°F, +4.5% winter precip April 1 Snowpack
~2050s to 2080s +3.6 (~2050s) to +5.4°F (~2080s) Streamflow Impacts Higher winter streamflows Earlier and lower peak runoff (mid/high basins) Lower late spring streamflow Lower, warmer summer streamflow Projected streamflow changes in the Quinalt and Yakima Rivers ~2050s to 2080s
Cascading impacts … UW Climate Impacts Group
Impacts to Many Local Concerns Forests/Timber Economies Water Quality Public Health Instream Flows Snow-dependent Water Supply Sea Level Rise Flood Risk Food production/ Ag Economies Energy Supply
Changing Risk for Today’s Problems Risk of drought increases… With 3.6°F warming, 50-year droughts become 10-year droughts and 10-year droughts become 2.2-year droughts (Scott et al. 2006) Risk of flooding changes…. General increase in risk of winter flooding and combined sewer overflows in low- and mid-elevation basins Lower risk of spring flooding in snowmelt basins due to lower spring snowpack
Floods Early peak flows Warm, low streamflow ?? Salmon Impacted Across Full Life-Cycle
Sea Level Rise (SLR) in the PNW • Thermal expansion of the global ocean; • Melting of land-based ice; • Atmospheric dynamics, particularly changes in wind which push coastal waters toward or away from shore; • Local tectonic processes (subsidence and uplift)
50” 40” 30” 20” 13” 10” 6” 6” 3” 2050 2100 Coasts Rising sea levels will increase the risk of flooding, erosion, and habitat loss along much of Washington’s 2,500 miles of coastline. • Medium estimates of SLR for 2100: • +2” for the NW Olympic Peninsula +11” for the central/southern coast+13” for Puget Sound • Higher estimates (up to 4 feet in Puget Sound) cannot be ruled out.
Inundation Levels in Olympia from Current and Projected Changes in High Tides A. Tidal datum elevation 18 feet B. Tidal datum elevation 19 feet C. Tidal datum elevation 20 feet D. Tidal datum elevation 22 feet
Other Projected Regional Impacts • Human HealthIncreased thermal stress from extreme heat events, decreased air quality (ozone; particulate matter), changes in range of/habitat for/exposure to disease vectors likely • RecreationShortened winter ski season (but improved access?), impacts in summer from forest fires • HydropowerIncreased winter streamflows benefit winter hydropower production; greater tradeoffs between hydropower, instream flows, irrigation, and recreation
Other Projected Regional Impacts • ForestsIncreased risk of wildfire, vulnerability to insects, decreased growth & regeneration • AgricultureDecreased irrigation supply, increased heat stress/insects, increased growing season • InfrastructureThe potential for more intense winter precipitation would increase the already high costs of stormwater management.
Responding to Climate Change: Mitigation and Adaptation Mitigation activities Reducing emissions of greenhouse gases Adaptation activities Reducing the impacts of climate change as mitigation strategies are debated and enacted.
Stabilization Wedges Billions of Tons Carbon Emitted per Year 16 GtC/y Current path = “ramp” 16 Eight “wedges” Goal: In 50 years, same global emissions as today Historical emissions 8 Flat path 1.6 0 1950 2000 2050 2100
Nuclear Fission What are the wedge strategies? Energy Efficiency & Conservation 16 GtC/y Renewable Fuels & Electricity Fuel Switching Stabilization Stabilization Triangle Triangle CO2 Capture & Storage 8 GtC/y Forest and Soil Storage 2007 2057 Carbon Mitigation Institute, Princeton University
Regional Climate Initiatives Over half of US may be covered by a regional GHG cap-and-trade system in 1-2 years Strong desire by stakeholders and policy makers to reflect regional concerns RGGI has already influenced draft national legislation, e.g. increasing inclination to auction permits Source: Pew Center for Climate Change, www.pewclimate.org
Climate Action In Washington State Western Climate Initiative WGA Clean and Diversified Energy Initiative West Coast Governor's Global Warming Initiative Washington Climate Plan Washington Commissions and Advisory Groups Washington Emissions Target Washington Power Plant Cap or Offsets Washington RPS (Renewable Portfolio Standards) Washington to Adopt CA Vehicle Standards Washington Appliance Standards Washington Biofuel Standard Washington EERS
Western Climate Initiative Regional Goal set in August 2007 15% below 2005 levels by 2020 “do their share” to reduce global emissions between 50% and 85% by 2050 September, 2008, announced regional cap-and-trade plan recommendations Phase 1 by 2012; Phase 2 by 2015 Currently includes 7 states, 4 provinces, with another 6 states, 1 province and 6 Mexican states observing New entrants must have: an equally stringent economy-wide GHG reduction goal a comprehensive multi-sector climate action plan to achieve the goal committed to adopt GHG tailpipe standards for passenger vehicles
Local Actions… Over 884 municipalities have signed US Mayors Climate Agreement (representing 81 million people) GHG emissions 7% below 1990 by 2012 Like states, cities/mayors are adopting detailed action plans focus on green buildings, low-carbon electricity supply, transportation alternatives, building energy efficiency testifying in Congress influencing regional policy (e.g. Texas coal plants) are, like governors, in a race to the top • King County - Ron Sims' Global Warming Initiative • Concrete action in county gov’t and agencies
Originally published October 24, 2008 at 12:00 AM | Page modified October 24, 2008 at 10:53 AM Guest columnist Solving the financial crisis by averting the climate crisis Despite the Wall Street meltdown and ongoing financial crisis, the next U.S. president must address the challenges of climate change and energy security. Investment in energy alternatives will help draw the nation out of financial doldrums. By Chip Giller and David Roberts Special to The Times Originally published October 20, 2008 at 12:00 AM | Page modified October 20, 2008 at 10:58 AM Neal Peirce / Syndicated columnist States, cities step up climate-change responses To meet the climate-change challenge, thousands of low-carbon strategies need to be fashioned from America's grass roots. Seattle and King County get it. By Neal Peirce Syndicated Columnist