Download
1 / 23
230 likes | 331 Views
Learn how to improve model fit by identifying new data for parameter estimates and predictions through the use of deterministic and statistical methods. Follow guidelines for model complexity, observation inclusion, and convergence.

E N D
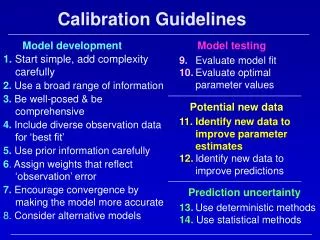
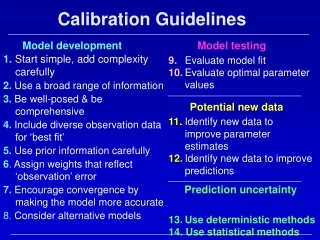
Calibration Guidelines Model development Model testing 9.Evaluate model fit 10.Evaluate optimal parameter values 11.Identify new data to improve parameter estimates 12. Identify new data to improve predictions 13.Use deterministic methods 14.Use statistical methods 1.Start simple, add complexity carefully 2. Use a broad range of information 3. Be well-posed & be comprehensive 4. Include diverse observation data for ‘best fit’ 5.Use prior information carefully 6. Assign weights that reflect ‘observation’ error 7. Encourage convergence by making the model more accurate 8. Consider alternative models Potential new data Prediction uncertainty
Hydrologic and hydrogeologic data Relate to model inputs Dependent variable Observations Relate to model outputs Guideline 11: Identify New Data to Improve Model Parameter Estimates and Evaluate Potential for Additional Estimated Parameters Here we consider measurements related to observations because the connection between hydrologic and hydrogeologic data is direct and needs no special statistics. Ground-Water Model -- Parameters Predictions Prediction uncertainty Societal decisions
Potential new observations to improveparameter estimates • Goal: evaluate worth of the type and location of potential observations. No observed value yet, so need statistics that don’t depend on this value. Use fit-independent statistics • In the context of reducing parameter uncertainty and increasing uniqueness, use the statistics: • A. Dimensionless scaled sensitivities. • B. One-percent scaled sensitivities. Often plotted in map form. • C. Parameter correlation coefficients • D. Leverage statistics • E. Influence statistics (not discussed here) • A. Dimensionless scaled sensitivities (dss): • Can be calculated for any potential observation type or location • Account for the expected accuracy of the measurements because dss include the observation weight. • Larger values identify observations that are likely to reduce parameter uncertainty.
B. Maps of one-percent scaled sensitivities • Conveniently shows spatial relations. • One map for each parameter, for each model layer, for each time step: potentially a huge number of maps!. • Inconvenient because can not determine the effect on the entire set of parameters. • Does not reflect the expected accuracy of observations in the different locations.
C. Parameter correlation coefficients • Calculate without and with the potential new data. If correlations with absolute values close to 1.00 become smaller, the new data will help attain unique parameter estimates. Example from Cape Cod (Anderman and others 1996; Anderman and Hill 2001) • Clearly illustrates that collecting flow and advective transport data can radically reduce the extreme parameter correlations that occur when only head are used.
D. Leverage Statistics • Indicate potential effect of an observation on a set of parameter estimates. Do not indicate the particular parameter(s) to which an observation is important Table 13.1, p. 331
Evaluation of possible additional estimated parameters What parameters could be supported in more detail, given the information in the observations? Use css
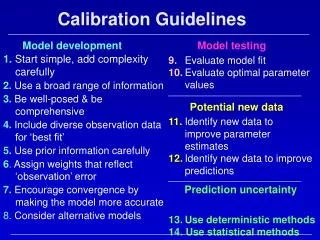
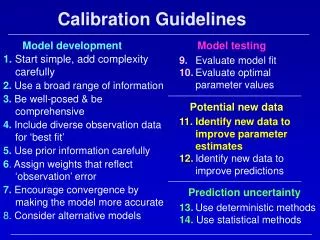
Calibration Guidelines Model development Model testing 9.Evaluate model fit 10.Evaluate optimal parameter values 11. Identify new data to improve parameter estimates 12.Identify new data to improve predictions 13.Use deterministic methods 14.Use statistical methods 1.Start simple, add complexity carefully 2. Use a broad range of information 3. Be well-posed & be comprehensive 4. Include diverse observation data for ‘best fit’ 5.Use prior information carefully 6. Assign weights that reflect ‘observation’ error 7. Encourage convergence by making the model more accurate 8. Consider alternative models Potential new data Prediction uncertainty
Hydrologic and hydrogeologic data Relate to model inputs Dependent variable Observations Relate to model outputs Guideline 12: Identify New Data to Improve Model Predictions Two categories of potential new data: Measurements related toobservations andhydrology and hydrogeology Ground-Water Model -- Parameters Predictions Prediction uncertainty Societal decisions
Potential new data to improve predictions • What existing or new observations are important to predictions? • Observation-Prediction Statistic (opr) • Which parameters are important to predictions? Infer important hydrologic and hydrogeologic data • Prediction scaled sensitivities (pss) with composite scaled sensitivies (css) and parameter correlation coefficients (pcc) • Parameter-Prediction Statistic (ppr)
Hydrologic and hydrogeologic data Relate to model inputs Dependent variable Observations Relate to model outputs Potential new observations to improve predictions Ground-Water Model -- Parameters Predictions Prediction uncertainty Societal decisions Approach: OPR
Potential new observations to improve predictions Observation-Prediction (opr) Statistic • Which existing observations are important to predictions? • opr indicates the percent increase in prediction uncertainty caused by omittingan existing observation • What new observations would be most valuable to predictions? • opr indicates the percent decrease in prediction uncertainty caused by adding a new observation • Advantages: • Combinesdss, css,andpssinto one statistic that also accounts for parameter correlation • is independent of model fit • is computationally manageable
Predictions of Interest in the Death Valley Model • Resource managers are interested in long-term, regional transport from selected sites, including all processes – advection, dispersion, reactions, adsorption and desorption • The regional model can be used to address advection. • Advective transport considered -- consistent with regional-scale model • Track movement in 3 coordinate directions – here, north-south, east-west, and vertical
Which existing observations are important(or not) to predictions? Use opr(-1) to rank the 501 existing observation locations by their importance to predictions • Averaged values of opr(-1) for all the predictions are used, to obtain a measure indicating the importance of a single observation to all the predictions of interest. • Calculate opr(-100)by removing the 100 least important observations • opr(-100)= mean prediction uncertainty increase = 0.6%
What new observations would be important(or not) to predictions? Consider potential new head observations in layer 1. Calculate opr(+1) for each cell in the layer.
Potential new data to improve predictions • What existing or new observations are important to predictions? • Observation-Prediction Statistic (opr) • Which parameters are important to predictions? Infer important hydrologic and hydrogeologic data • Prediction scaled sensitivities (pss) with composite scaled sensitivies (css) and parameter correlation coefficients (pcc) • Parameter-Prediction Statistic (ppr)
Hydrologic and hydrogeologic data Relate to model inputs Dependent variable Observations Relate to model outputs Potential new system property information to improve predictions Ground-Water Model -- Parameters Predictions Prediction uncertainty Societal decisions • Two approaches: • Prediction scaled sensitivities (pss) together with composite scaled sensitivities (css)and parameter correlations (pcc) • Parameter-prediction (ppr) statistic
A. Prediction Scaled Sensitivities (pss): What parameters are important to predictions? Here, pss are scaled to equal percent change in prediction caused by 1% change in parameter value pss- desired model complexity
css – supported model complexity pss – desired model complexity
B. Parameter-Prediction (ppr) Statistic • Which parameters are important to predictions? • ppr indicatespercent decrease in prediction uncertaintycaused by adecrease in parameter uncertainty. • The decrease in parameter uncertainty is implemented by increasing the weight on prior information for the parameter(s). • Thisincrease in weightrepresentsthe increased certainty that would result from collection of additional field data about the parameter or associated system property.
Predictions of Interest in the Death Valley Model(simulations from the 3-layer model of D’Agnese +, 1998) Apply ppr statistic to one prediction on Yucca Flat
Which individual parameters (and associated system features) would be most beneficial to further characterize in the field? Ppr statistic(percent decrease in prediction uncertainty) Hydraulic Conductivity Recharge Parameter with Improved Information
Pros and cons of A (pss+) and B (ppr) • Prediction scaled sensitivities (pss) together with composite scaled sensitivities (css)and parameter correlations (pcc) • PRO: pss, css, and pcc are each conceptually easy to understand and convey to others • PRO: independent of model fit and computationally manageable • CON: Can be cumbersome to evaluate the three measures to determine the value of new system property data • Parameter-prediction (ppr) statistic • PRO: Combinescss, pss, and pccinto one statistic • PRO: independent of model fit and computationally manageable • CON: More conceptually difficult to understand and explain to others. Best so far -- express in terms of percent changes in prediction uncertainty