Download
1 / 32
320 likes | 450 Views
This workshop presentation explores the innovative approach of Road Segment Forecasting (RSF) to improve salt spreading for road maintenance. Presented by experts from the Danish Meteorological Institute, the talk highlights the integration of GPS technology in salt spreaders, allowing for automated control of spreading patterns and salt application based on precise road condition forecasts. The discussion includes quality measures of forecasts, examples of implementation, and future potential for RSF in optimizing road safety and efficiency during winter conditions.

E N D
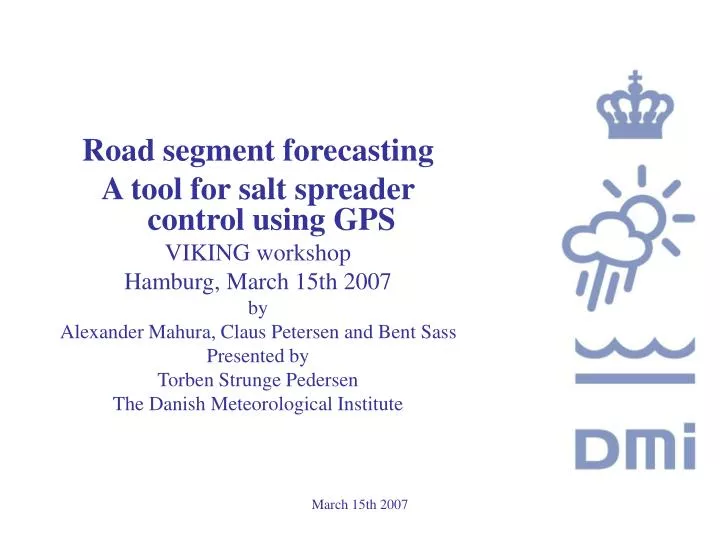
Road segment forecasting A tool for salt spreader control using GPS VIKING workshop Hamburg, March 15th 2007 by Alexander Mahura, Claus Petersen and Bent Sass Presented by Torben Strunge Pedersen The Danish Meteorological Institute March 15th 2007
Outline of the talk • What is Road Segment Forecasting (RSF) ? • A RSF method • The Potential in RSF • Quality and examples • The future March 15th 2007
Road station March 15th 2007
Point forecasts (PF) from Road Condition Model (RCM) – Showing status March 15th 2007
RSF - Showing status March 15th 2007
Ice car – Used for thermal mapping March 15th 2007
Thermal mapping, Halskov - Ringsted Left and right lane March 15th 2007
Mean thermal mapping profile March 15th 2007
GPS equipped spreaders • GPS has opened the opportunity for automatic control of width and asymmetry of the spreading pattern • With reliable weather forecasts for segments of the route the automation can be taken a step further – to automatically vary the amount of salt applied along the route March 15th 2007
New equipment for spreaders • The price of infrared sensors determining the temperature of the road surface has come down • Together with GPS this makes it economically possible to get thermal mapping data from spreaders in operation • Provide data for validation March 15th 2007
Infra red sensor mounted on spreader March 15th 2007
Infra red sensor mounted on spreader March 15th 2007
Test route – 2005 / 2006 season Route VA 4 - Ribe County March 15th 2007
Road segment forecast • Based on PF ”near” the route forecasts for 2 km segments are obtained by interpolation • Note this method does not use information from the infra red sensors! March 15th 2007
End user presentation March 15th 2007
Forecast quality • Making a forecast is easy • But what is the quality ? • Here we will look at quality through two measures • Mean Deviation (MD) • Mean Absolute Deviation (MAD) March 15th 2007
Forecast quality NWP • NWP MAD – PF for road stations March 15th 2007
Forecast quality – Present system • NWP versus RCM MAD – PF for road stations March 15th 2007
Forecast quality – Present system • The importance of road stations March 15th 2007
RSF-Potential - Hypothetical route March 15th 2007
“RSF” potential March 15th 2007
Route VA 4 – thirty 2 km segments March 15th 2007
Measurements from spreaders • 2005 – 2006 season • 102 operations available (duration from minutes to about 4 hours) • 90.459 measurements in all • Time averaging (1 min.) and allocation to the corresponding 2 km road segment reduces the amount available for the evaluation to 5.844 measurements March 15th 2007
Amount of observations by segment March 15th 2007
Comparison of observations Infra red sensor versus road station Starup MD -0.11 degree MAD 0.51 degree March 15th 2007
RSF (3 hour) versus observation I March 15th 2007
RSF (3 hour) versus observation II March 15th 2007
RSF (3 hour) versus observations MD March 15th 2007
RSF (3 hour) versus observation MAD March 15th 2007
The future • The near future (now) • Integration of infra red sensor data in the RCM / RSF forecasting • Increased horizontal resolution in the RCM • Include more test routes • The not so distant future • Use of RSF for applying variable amounts of salt along routes • And then – eventually • Integration of RSF in spreaders for automatic controlling of the salt amount used March 15th 2007
Conclusion • The technology for developing and evaluate RSF is available • This pilot study shows that the quality of RSF is nearly comparable to the one known from state of the art PF • Road stations are essential for a good quality of forecasts (both PF and RSF) March 15th 2007
The future is very near (you)! Thank you for your attention!!! March 15th 2007