Download
1 / 20
200 likes | 538 Views
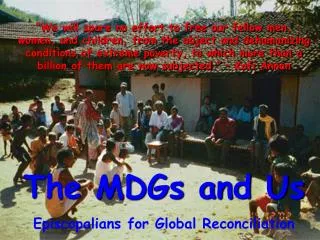
In the General Convention, 2003, The Episcopal Church passed legislation that: ... If every Episcopalian in the Episcopal Church gave 0.7% of his or her income we ...

E N D
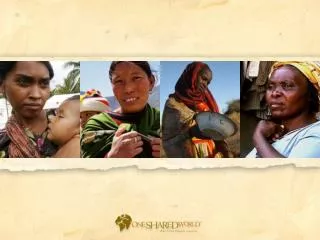
Slide 1:This picture was taken by Manu Mathia in Orissa, India. Three-quarters of these people � who come from tribal communities � live in absolute poverty. The state of Orissa has one of the highest Infant Mortality Rates (IMR) in the world at 124 per 1000 live births. This picture was taken by Manu Mathia in Orissa, India. Three-quarters of these people � who come from tribal communities � live in absolute poverty. The state of Orissa has one of the highest Infant Mortality Rates (IMR) in the world at 124 per 1000 live births.
Slide 2:Lazarus at our Gate: A Study of Global Poverty and Response
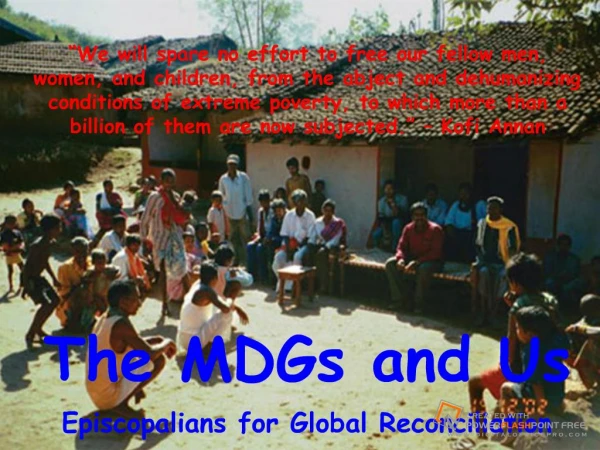
GLOBAL POVERTY - Facts & Trends OUR CURRENT RESPONSE EPISCOPALIANS FOR GLOBAL RECONCILIATION These are the topics of the full slide show: GLOBAL POVERTY - Facts & Trends What are the MDGs? Who are the poor? How much progress have we made? What is possible? OUR CURRENT RESPONSE What has been our response? Why has it diminished? How much would it cost to meet the MDGs? What is the response to date of our government, our church, our foundations and our corporations? EPISCOPALIANS FOR GLOBAL RECONCILIATION A movement of Episcopalians committed to Praying, Advocating, Teaching, Going, Giving, Listening, LearningThese are the topics of the full slide show: GLOBAL POVERTY - Facts & TrendsWhat are the MDGs? Who are the poor? How much progress have we made? What is possible? OUR CURRENT RESPONSE What has been our response? Why has it diminished? How much would it cost to meet the MDGs? What is the response to date of our government, our church, our foundations and our corporations? EPISCOPALIANS FOR GLOBAL RECONCILIATIONA movement of Episcopalians committed to Praying, Advocating, Teaching, Going, Giving, Listening, Learning
Slide 3:OUR CURRENT RESPONSE
Slide 4:I do not mean that there should be relief for others and pressure on you, but it is a question of a fair balance between your present abundance and their need, so that their abundance may be for your need, in order that there may be a fair balance. As it is written, �The one who had much did not have too much, and the one who had little did not have too little.� 2 Corinthians 8:13-15
Slide 5:Q: How much would it cost to meet the MDGs?
A: Around $100 billion a year from now until 2015. At present, the developed countries provide $58 billion in overseas development assistance. This has to double. That is, we will need at least an additional $30 to $50 billion every year from now until 2015. That�s a lot of money! But is it really?
Slide 6:In 2002 the US gave $13.3 billion in Development Assistance, up 15% from 2001 and the most of any country. US Defense Expenditure is nearly 400 billion. In 2003 the US spent over $75 billion on the War in Iraq. Budgets reflect priorities. We could give more � it�s not asking much.
Slide 7:Budget Priorities in 2003
Myths are hard to break! Year after year pollsters find that Americans think the US gives 15 times more than we actually give for development assistance. They also find that Americans consistently *want* us to give more than we do, but don�t demand it effectively. Americans think that the US is the world�s main �do-gooder� for the poor. But the US gives only 13 of the 58 billion of development assistance in 2003. That is, we give less than � of the total development assistance of rich countries to developed countries. Other nations add 45 billion to our 13. The goal for development assistance is 100 billion dollars per year. Just to put this in perspective, if the US were the *only* rich country giver, it would still take only � of the US military budget in 2003 for the US single-handedly to end world poverty. But we are not alone � we play on a global team. If the US were to pay for the difference between current aid and what is necessary, we would need to bring our total contribution to $55 billion. While this would be a significant, even revolutionary, change, it would amount to giving less than 0.7% of our GNI. (0.7% would be 75 billion). Americans think that the US is the world�s main �do-gooder� for the poor. But the US gives only 13 of the 58 billion of development assistance in 2003. That is, we give less than � of the total development assistance of rich countries to developed countries. Other nations add 45 billion to our 13. The goal for development assistance is 100 billion dollars per year. Just to put this in perspective, if the US were the *only* rich country giver, it would still take only � of the US military budget in 2003 for the US single-handedly to end world poverty. But we are not alone � we play on a global team. If the US were to pay for the difference between current aid and what is necessary, we would need to bring our total contribution to $55 billion. While this would be a significant, even revolutionary, change, it would amount to giving less than 0.7% of our GNI. (0.7% would be 75 billion).
[1] Of donor countries in 2000 US$ [2] to least developed countries as a percentage of total ODA [3] as a % of GNI Gold = give 0.7% already The US is the world�s biggest giver in real terms, but the world�s smallest giver in percentages. Total ODA = $58 billionSlide 9:US Giving over time: low
Slide 10:But is Money effective? Isn�t it mostly wasted?
A: We have gotten better � dramatically better � at using development assistance How? we waste a lot less money we pay attention to governance, and fight corruption. we put resources in the hands of the poor we involve and listen to the poor � they find their answers. we create pro-poor growth (where the poor get jobs) we invest in education and health we have data to track progress and respond in a timely way we have better technology. Money isn�t enough. We have to change trade regimes, and debt is still an issue and must be part of our advocacy work. But money is one key lever. Q: Is Money effective? Isn�t it mostly wasted? A: We have gotten better � dramatically better � at using development assistance (this is the term for what used to be called aid). Studies suggest that our ability (as donors working in mutual partnership with poor people, with civil society groups, and with governments) to reduce poverty permanently has increased considerably. Why? - we waste a lot less money on huge projects that don't work, or that don't reduce poverty. - we recognize the importance of governance, and are able to encourage accountability and fight corruption. - we have learned how to put resources in the hands of the poor so they can solve their problems productively. - we have learned how to involve and listen to the poor so we know what works and what doesn't, and can build on their knowledge and respect their culture - we know that we need to create pro-poor growth (growth where the poor get jobs and increase their productivity) - we recognize that investment in education and health are means to growth as well as ends in themselves. - we have, for the first time in history, enough data to track progress as never before and respond in a timely way - we have better technology - to deliver heath care, lay roads, make water drinkable, improve seeds and use email. Q: Is Money effective? Isn�t it mostly wasted? A: We have gotten better � dramatically better � at using development assistance (this is the term for what used to be called aid). Studies suggest that our ability (as donors working in mutual partnership with poor people, with civil society groups, and with governments) to reduce poverty permanently has increased considerably. Why? - we waste a lot less money on huge projects that don't work, or that don't reduce poverty. - we recognize the importance of governance, and are able to encourage accountability and fight corruption. - we have learned how to put resources in the hands of the poor so they can solve their problems productively. - we have learned how to involve and listen to the poor so we know what works and what doesn't, and can build on their knowledge and respect their culture - we know that we need to create pro-poor growth (growth where the poor get jobs and increase their productivity) - we recognize that investment in education and health are means to growth as well as ends in themselves. - we have, for the first time in history, enough data to track progress as never before and respond in a timely way - we have better technology - to deliver heath care, lay roads, make water drinkable, improve seeds and use email.
Slide 11:How has our World responded?
In 2002, the percentage of GNI given increased for the first time in 3 years. Giving in 2002 to 0.23% - up from the all-time low of 0.22% that was given from 1999-2001. While this is good news, remember that in 1990, countries gave on average 0.33% of GNI, and in the 1960s they gave 0.5%. In 2002 United States� development assistance increased 15% to US$13.3 billion (0.13% of GNI). The European Union contributed US$29.95 billion (0.35% of combined GNI). Source: www.oecd.org/development
Slide 12:How has our Church responded?
In the General Convention, 2003, The Episcopal Church passed legislation that: A) supported the MDGs B) called on diocese, parishes, and individuals to give 0.7% of income overseas
Slide 13:25 of 107 Dioceses have responded
Massachusetts, Western Massachusetts, Newark, Pittsburgh, Central New York, and Los Angeles already give 0.7%!!! Maine will join them soon. Bethleham, California, Chicago, Nevada, Pennsylvania, Iowa, Long Island, Milwaukee, Missouri, Nevada, New York, North Carolina, Pennsylvania, Rhode Island, SE Florida, East Tennessee, Wyoming, and the Convocation of American Churches in Europe, have passed resolutions supporting 0.7 giving by parishes and/or the diocese. West Missouri wants to study it for two years before committing funds. Alabama, Kentucky, and Southern Virginia will vote on this at their next convention.
Slide 14:Why should we give 0.7% Overseas?
Because American Christians forget to give outside of our borders !
Slide 15:Americans are a generous people. We give of our time, our love, our money. But less than 2% of Americans� gifts leave our country. Of the $241 billion we gave in 2002, only $4.6 billion � less than 2% - supported international programs relating to peace and security, arts and culture, poverty alleviation, education, health, and the environment. (Giving USA 2003, AAFRC Trust for Philanthropy.) The 0.7% ruler reminds us to send some of our tithe, some of our donations, some of our gifts, to our sisters and brothers overseas. Send more if you can by all means! But please send some.
Slide 16:Where did 0.7% come from?
In 1970, the United Nations General Assembly identified 0.7% as a target for international development assistance. Since then, the number 0.7% keeps appearing. It is especially important to give 0.7% now that we have committed to the MDGs.
Slide 17:Is 0.7% giving enough?
It depends who gives� If every diocese in the Episcopal Church gave 0.7% we would raise: DIOCESES = $ 1.2 million every year If every parish in the Episcopal Church gave 0.7% we would raise: PARISH = $9.8 million every year If every Episcopalian in the Episcopal Church gave 0.7% of his or her income we would raise: EPISCOPALIANS $354 million every year =$0.354 billion every year
Slide 18:Is 0.7% giving enough? (cont�d)
If the United States Government gave 0.7% of our Gross National Income we would raise: US GOVERNMENT $73 billion / year If all the rich countries gave 0.7% of our Gross National Income we would raise about: WORLD $175 billion / year
Slide 19:A Prayer:
Most loving God, As your desire for mercy for the poor is unrelenting, may we be unrelenting in our pursuit of mercy for all; As your compassion for the suffering of the poor knows no limit, may our hearts overflow with compassion for all; As you long for justice for the poor, may we strive for justice for all. Forgive us our meager faith that doubts your providence and bounty, and our abiding neglect of your Son in the poor and needy of the world; Open our eyes to the structures of oppression from which we benefit, and give us courage to accept our responsibility, wisdom to chart a sound course amid complexity, and perseverance to continue our work until it is finished. Breathe your life-giving Spirit afresh into your Church to free us from apathy and indifference, and so bless and direct our endeavors that we may be agents of your mercy, compassion, and justice, to the end that new life and hope may abound and your Name be praised in every place; through Jesus Christ our Lord. Amen.
Slide 20:How much is 0.7% of my income?
Income 0.7% $5 3� cents $10 7 cents $50 35 cents $100 70 cents $1000 $7 $5,000 $35 $7,000 $49 $10,000 $70 $15,000 $105 $20,000 $140 $25,000 $175 $30,000 $210 $35,000 $245 $40,000 $280 $45,000 $315 $50,000 $350 $55,000 $385 $60,000 $420 $65,000 $455 $70,000 $490 $75,000 $525 $80,000 $560 $85,000 $595 $90,000 $630 $95,000 $665 $100,000 $700 $120,000 $840 $140,000 $980 $160,000 $1,120 $180,000 $1,260 $200,000 $1,400 $250,000 $1,750 $300,000 $2,100 $350,000 $2,450 $400,000 $2,800 $450,000 $3,150 $500,000 $3,500 $1,000,000 $7,000