Download
1 / 36
380 likes | 726 Views
Wet Stack Fine Particulate Method Development. Dan Bivins and Jason DeWees USEPA, OAQPS, RTP, NC. STAKEHOLDER PARTICIPATION. This method development is a stakeholder participation program, supported by EPRI, NCASI, EPA (OAQPS), and DRI.

E N D
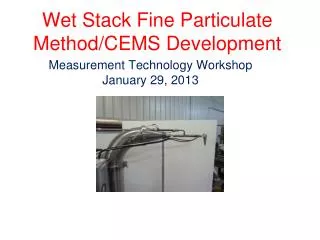
Wet Stack Fine Particulate Method Development Dan Bivins and Jason DeWees USEPA, OAQPS, RTP, NC
STAKEHOLDER PARTICIPATION This method development is a stakeholder participation program, supported by EPRI, NCASI, EPA (OAQPS), and DRI. Stakeholders actively participate by receiving interim reports from EPA. Periodic stakeholder telephone conference calls are held at report outs during the project.
METHOD DEVELOPMENT APPROACH • Approach is to develop a protocol that has criteria for acceptance of a method and monitor, based on lab and field testing • The plan is to characterize a set of droplet generators within a wet test simulator for testing 20u or less droplet separators • Then challenge the INERTIAL DROPLET SEPARATOR (IDS) with known droplet matrices • We will integrate the IDS into a dilution sampling analysis system for wet testing
DILUTION FINE PM SAMPLING TECHNOLOGY • FINE PM SAMPLER DESIGN TO EMULATE ASTM COMMITTEE D22.03 WORKING GROUP RECOMMENDATIONS • SAMPLE LIQUID DROPLETS LESS THAN 20u IN A SATURATED STACK USING AN INERTIAL DROPLET SEPARATOR • IMMEDIATE DILUTION OF THE STACK GAS • AGING AT 85 F. • PARTICLE FORMATION • CONDENSABLE PARTICLE FORMATION WITH A 10 SECOND RESIDENCE TIME • FRACTIONATION OCCURS AFTER DILUTION WITH SHARP CUT CYCLONES • FINAL PARTICULATE ANALYSIS WITH AN AMBIENT BETA ATTENUATION MONITOR (BAM)
NEW DROPLET SEPARATOR FOR SELECTING TARGET DROPLETS FOR ANALYSIS INTRODUCTION OF AN INERTIAL DROPLET SEPARATOR (IDS) DESIGNED TO SAMPLE WATER DROPLETS OF 20 MICRON OR SMALLER TRANSFERS THE DROPLETS TO AN EVAPORATOR/DILUTION PROBE RAPID WATER EVAPORATON TO YIELD DRY PARTICLE
CURENT PROJECT HIGHLIGHTS • Review results of dry test program • Conclusions from dry test program • Present Wet Stack Simulator Design • Wet Simulator Droplet Generating Performance • IDS Performance in wet simulator • Next Steps
DRY TEST PROGRAM OBJECTIVES • Construct prototype Inertial Droplet Separator (IDS) • Conduct laboratory tests under dry stack conditions to demonstrate proof of concept • Reject collection of particles above the 20-30 um diameter range • Test media: glass beads, Arizona road dust • Simultaneous Isokinetic tests to measure concentration in stack and IDS tests to compare to Isokinetic results • Evaluate the sample effectiveness of the IDS against desired objectives • SAMPLE EFFECTIVENESS is the % capture of the target particle size
TEST PROTOCOLS • Simultaneous Isokinetic & IDS • Cloud Droplet Probe (CDP) • Characterization of Media Particle Size • CDP is calibrated with Potter 5000 Glass Beads from the factory • Sequential testing with CDP, Isokinetic, and Flow Through Cell CDP (FCDP) • Sequential CDP and IDS: Arizona Road Dust
POTTER 5000 GLASS BEADSCUMULATIVE MASS DISTRIBUTION Position 5 North South 90 Position 7 Position 9 70 50 Cumulative Mass Percent 30 10 90 70 Cumulative Mass Percent 50 Potter 4000 Glass Beads Cumulative Mass Distribution 30 10 0 10 20 30 40 50 60 70 80 90 Aerodynamic Diameter (micrometers)
IDS SIZE CUT ANALYSIS BASED ON THE IDS/ ISOKINETIC RATIO: ALL POTTER 5000 SAMPLES IDS cut pointAvg: 19.8 µmLow: 17.7 µmHigh: 21.7 µm
ISO DRY TEST FINDINGS • WASH RECOVERIES WERE >50% OF TOTAL RECOVERED MASS: • LARGE PARTICLES DROPPING OUT IN NOZZLE/TUBING • MICROSCOPIC ANALYSIS CONFIRMED • A CONTINUOUS ANALYSIS METHOD WAS REQUIRED FOR EVALUATING THE IDS BEAD CAPTURE--CDP
Use CDP to Characterize Test Media Particle and Mass Distribution in the Duct and downstream of the IDS SWITCH TO CDP FORCONTINUOUS ANALYSIS
CDP OPERATING PRINCIPLE • CLOUD DROPLET PROBE USED FOR SIZE AND MASS DISTRIBUTION OF WATER DROPLETS IN CLOUDS • LASER LIGHT FORWARD SCATTER PRINCIPLE • The cone of photons that is forward scattered in the 4° to 12° range is collected and measured. • Intensity of scatter light is proportional to particle size.
CDP (IN YELLOW) AND BOTTOM HALF OF THE FLOW THROUGH CELL (CLAM SHELL DESIGN From IDS
FLOW THROUGH CELL TESTING, WITHOUT ISOKINETIC SAMPLING • Test stack with CDP in Open Path Mode • Remove CDP and insert IDS with Flow Through Cell CDP (FCDP) in-line • Real time analysis of the IDS sample fraction • Compare the in stack particle distribution to the IDS sample cut downstream of the IDS • We were looking for a better way to determine the percent transmission cut point for the IDS
INDIVIDUAL RUNS: CDP RAW COUNTS OF POTTER 4000 IN DUCT AND AFTER IDS WITH IDS AT 10 LPM
IDS & FLOW THROUGH CDP OBSERVATIONS • At sample flow rates of 10 and 5 lpm IDS is collecting majority of particles smaller than 20 to 30 um. • Performance is consistent for both Potter 5000, 4000, and Arizona Road Dust with respect to each other. • One issue with the CDP data reporting is low counts for larger particles.
ARIZONA ROAD DUST (ARD) • Conduct additional dry testing using different sample media to better determine separation performance of IDS • Fine distribution ARD; 0-3 um (Physical) • IDS should collect all • Medium distribution ARD: 40-80 um (physical) • IDS should not collect most
Arizona Road Dust a Not corrected (i.e. no background subtraction) b Reentrainment of media with intake air to blower
ARIZONA ROAD DUST CONCLUSIONS • IDS collected all of fine ARD • For larger ARD, results consistent with Potter 5000 glass beads. Indicated IDS is collecting some of the larger particles in the 40-80 um ARD sample.
WET DROPLET SIMULATORSPRAY HEAD PERFORMANCE CURVES FOR WATER
Results/Conclusions • Based on ratio of IDS:Isokinetic mass collected and CDP in-stack particle size distribution: • Dry tests • IDS is transmitting (collecting) greater than 90% of fine particles < 10 μm • IDS is cutting (not transmitting) particles greater than 20 to 50 μm aerodynamic; (results varied depending upon media) • Wet tests: • IDS is cutting in the range of 10 to 25 μm aerodynamic • IDS is effective at cutting large droplets, but cut point is uncertain; want to better quantify
NEXT STEPS • Test IDS/dilution train in simulator stack under wet conditions • Objective: Proof of concept that IDS/dilution train system will sufficiently eliminate large droplets and transport sample to PM2.5 cyclone/filter system • Field Test IDS/dilution train • Objective: Proof of concept under actual field conditions • Laboratory evaluation of IDS with monodisperse aerosol • Objective: Better quantify d50 of IDS