Download
1 / 38
380 likes | 503 Views
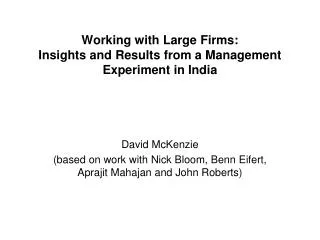
Working with Large Firms: Insights and Results from a Management Experiment in India. David McKenzie (based on work with Nick Bloom, Benn Eifert , Aprajit Mahajan and John Roberts). blogs.worldbank.org/ impactevaluations. What do we know so far?.

E N D
Working with Large Firms: Insights and Results from a Management Experiment in India David McKenzie (based on work with Nick Bloom, Benn Eifert, AprajitMahajan and John Roberts)
What do we know so far? • Rapid growth in recent years in impact evaluations on microenterprises (microfinance, business training, grants, etc.) • Much less in the way of rigorous impact evaluations for SMEs and large firms, and what does exist is largely based on ex post evaluations. • Yet SMEs and large firms are important for job creation and productivity growth, and there are many Bank and Govt. projects tailored at them -> so important to do more IEs. • More challenging to do so however, since fewer of such firms, can be difficult to get enough power -> need to move beyond simple baseline-follow-up model of evaluation.
A management experiment in India • Question: Can differences in management practices explain differences in firm productivity? • May seem obvious, but despite massive literature going back at least to Walker (1887) no consensus Syverson (2011) “no potential driving factor of productivity has seen a higher ratio of speculation to empirical study”. • Identification: Randomize a management intervention over a group of large Indian textile firms
International data suggests bad management could be one factor behind underdevelopment Ave. management score, random sample of population firms 100 to 5000 employees (monitoring, targets and incentives management scored on a 1 to 5 scale. See Bloom and Van Reenen (2007, QJE) and Bloom, Sadun and Van Reenen (2010, JEP)) 5
What we do: conduct an experiment to evaluate the impact of more modern management practices • Experiment on 20 plants owned by 17 large firms (multi-plant with ≈ 300 employees each) near Mumbai making cotton fabric • Randomized treatment plants get five months of a standard management consulting intervention, controls get 1 month • Consulting on 38 specific practices tied to factory operations, quality and inventory control, and human-resource management. • Collect weekly data on all plants from 2008 to 2010. So far productivity up 15%, profits up about $230,000 per year
Exhibit 1: Plants are large compounds, often containing several buildings.
Exhibit 2a: Plants operate continuously making cotton fabric from yarn Fabric warping
Exhibit 2b: Plants operate continuously making cotton fabric from yarn Fabric weaving
Exhibit 2c: Plants operate continuously making cotton fabric from yarn Quality checking
Exhibit 4: The plant floors were often disorganized and aisles blocked Instrument not removed after use, blocking hallway. Old warp beam, chairs and a desk obstructing the plant floor Dirty and poorly maintained machines Tools left on the floor after use
Exhibit 5: The inventory rooms had months of excess yarn, often without any formal storage system or protection from damp or crushing Yarn without labeling, order or damp protection Yarn piled up so high and deep that access to back sacks is almost impossible Different types and colors of yarn lying mixed A crushed yarn cone, which is unusable as it leads to irregular yarn tension
Experimental Design • Experimental sample: • Began with population of woven cotton fabric firms (SIC 2211) near Mumbai with 100 to 1000 employees. • Restricted to firms in Tarapur and Umbergaon (main cotton fabric center around Mumbai) giving 66 firms • Contacted every firm with offer of free consulting, 34 interested, 17 could start immediately • These 17 firms did not differ in BVR management practices (p=0.859) or assets (p=0.841) from other 49 • Randomize into 14 treatment and 6 control plants. • Illustrates one approach to dealing with low take-up concerns – focus in on the more interested firms
Can we learn from this small sample? (1/2) Small sample because this is expensive! (~75K per treated plant), why also no prior large-firm management experiments • Is this sample large enough to get significant results? Yes: - Homogeneous production, location, and technology, so most external shocks controlled for with time dummies. • Large plants with 80 looms and 130 employees so individual machine and employee shocks average out • Data from machines & logs so little measurement error • High frequency data: 114 weeks of data (large T) i.e. overcome in part problem of small cross-sectional sample size by collecting a lot more data on each firm.
Can we learn from this small sample? (2/2) 2) Need to use appropriate statistical inference: • Use bootstrap firm-clustered standard-errors as baseline • Also use permutation tests (12,376 possible ways of choosing 11 treated from 17 firms) to get test statistics which don’t rely on asymptotics. • Use large T-asymptoticsfrom Ibramigov-Mueller (2009) • Remove time effects • Estimate parameter of interest separately for each treatment firm, then treat resultant 11 estimates as a draw from a t distribution with 10 d.f. • This provides robustness to heterogeneity across firms also. All three methods give similar results
Management practices before and after treatment Performance of the plants before and after treatment Why were these practices not introduced before? 16
The Intervention • Hired Accenture Consulting through open tender to implement a set of management practices across plants • All plants got 1 month diagnostic phase: evaluated current management and constructed performance database. • Treatment plants then got 4 month implementation phase: worked on introducing 38 basic management practices. • Randomized treatment into two-waves, so those treated in second wave could serve as controls over first part also.
Intervention aimed to improve 38 core textile management practices in 5 areas • Quality • Operations • Inventory management • Human Resources • Sales & Orders
Figure 2: The adoption of key textile management practices over time Treatment plants (●) Control plants (♦) Share of key textile management practices adopted Non-experimental plants in treatment firms (+) Notes: Average adoption rates of the 38 key textile manufacturing management practices listed in Table 2. Shown separately for the 14 treatment plants (round symbol), 6 control plants (diamond symbol) and the 5 non-experimental plants in the treatment firms which the consultants did not provide any direct consulting assistance to (+ symbol). Scores range from 0 (if none of the group of plants have adopted any of the 38 management practices) to 1 (if all of the group of plants have adopted all of the 38 management practices). Initial differences across all the groups are not statistically significant.
Management practices before and after treatment Performance of the plants before and after treatment Why were these practices not introduced before? Management and IT
Look at four outcomes we have weekly data for Quality: Measured by Quality Defects Index (QDI) – a weighted average of quality defects (higher=worse quality) Inventory: Measured in log tons Output: Production picks (one pick=one run of the shuttle) Productivity: Log(VA) – 0.42*log(K) – 0.58*log(L) Estimate ITT; plus regress outcomes on management Run in OLS and also instrument management with treatment
Poor quality meant 19% of manpower went on repairs Large room full of repair workers (the day shift) Workers spread cloth over lighted plates to spot defects Defects are repaired by hand or cut out from cloth Defects lead to about 5% of cloth being scrapped
Previously mending was recorded only to cross-check against customers’ claims for rebates Defects log with defects not recorded in an standardized format. These defects were recorded solely as a record in case of customer complaints. The data was not aggregated or analyzed
Now mending is recorded daily in a standard format, so it can analyzed by loom, shift, design & weaver 24
The quality data is now collated and analyzed as part of the new daily production meetings Plant managers now meet regularly with heads of quality, inventory, weaving, maintenance, warping etc. to analyze data
Figure 3: Quality defects index for the treatment and control plants Start of Diagnostic Start of Implementation End of Implementation 97.5th percentile Quality defects index (higher score=lower quality) Average (♦ symbol) Control plants 2.5th percentile 97.5th percentile Average (+ symbol) Treatment plants 2.5th percentile Weeks after the start of the diagnostic Notes: Displays the average weekly quality defects index, which is a weighted index of quality defects, so a higher score means lower quality. This is plotted for the 14 treatment plants (+symbols) and the 6 control plants (♦symbols). Values normalized so both series have an average of 100 prior to the start of the intervention. To obtain confidence intervals we bootstrapped the firms with replacement 250 times.
ITT to treat estimations Standard errors bootstrap clustered by firm
Organizing and racking inventory enables firms to substantially reduce capital stock Stock is organized, labeled, and entered into an Electronic Resource Planning (ERP) system which has details of the type, age and location. Bagging and racking yarn reduces waste from rotting (keeps the yarn dry) and crushing Computerized inventory systems help to reduce stock levels.
Sales are also informed about excess yarn stock so they can incorporate this in new designs. Shade cards now produced for all surplus yarn. These are sent to the design team in Mumbai to use in future products
Figure 4: Yarn inventory for the treatment and control plants Start of Diagnostic Start of Implementation End of Implementation 97.5th percentile Average (♦ symbol) Control plants 97.5th percentile Yarn inventory (normalized to 100 prior to diagnostic) 2.5th percentile Average (+ symbol) Treatment plants 2.5th percentile Weeks after the start of the intervention
Many treated firms have also introduced basic initiatives (called “5S”) to organize the plant floor Worker involved in 5S initiative on the shop floor, marking out the area around the model machine Snag tagging to identify the abnormalities on & around the machines, such as redundant materials, broken equipment, or accident areas. The operator and the maintenance team is responsible for removing these abnormalities.
Spare parts were also organized, reducing downtime (parts can be found quickly) and waste Nuts & bolts sorted as per specifications Parts like gears, bushes, sorted as per specifications Tool storage organized
Production data is now collected in a standardized format, for discussion in the daily meetings After (standardized, so easy to enter daily into a computer) Before(not standardized, on loose pieces of paper)
Daily performance boards have also been put up, with incentive pay for employees based on this
Figure 6: TFP for the treatment and control plants Start of Diagnostic Start of Implementation End of Implementation 97.5th percentile Treatment plants Average (+ symbol) TFP (normalized to 100 prior to diagnostic) 2.5th percentile 97.5th percentile Control plants Average (♦ symbol) 2.5th percentile
Practices increased profits, and revealed preference also shows this to be valuable • Estimate the increased output, lower labor costs and lower capital costs increased profits by about $230,000 per plant • Also showed that the 5 other plants that are part of the same firms as the treated plants increased their adoption of these 38 management practices by 17.5 percentage • Recall treated plants increased adoption by 37.8 percentage points, so just under half the new practices were transferred across to other plants.
Lessons for other SME/Large firm impact evaluations • Less can be more: focus on a homogeneous set of firms whose production process can be measured well and in relatively standardized way • More is more: collect a lot more data on these firms • lots of time series data on key outputs • Process data (e.g. detailed data collected on each management practice to understand why it wasn’t done beforehand) • First-stage data – here collected data on whether management practices changing – first step in any IE is to measure whether it is changing behavior.
Summary Management matters in Indian firms – large impacts on productivity and profitability from more modern practices A primary reason for bad management appears to be lack of information, which limited competition allows to persist Policy implications A) Competition and FDI: free product markets and encourage foreign multinationals to accelerate spread of best practices B) Training: improved basic training around management skills C) Rule of law: improve rule of law to encourage reallocation and ownership and control separation 38