Download
1 / 25
250 likes | 448 Views
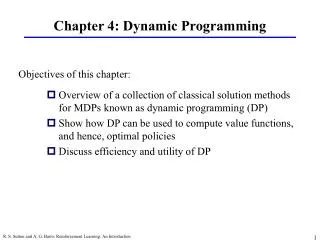
Dynamic Recompilation of Legacy Applications: A Case Study of Prefetching using Dynamic Monitoring. Mauricio Serrano, Jose Castanos, Hubertus Franke. Outline. Overview of the Dynamic Compilation Infrastructure PFLOATRAN Application Delinquent Load Optimization Performance Results

E N D
Dynamic Recompilation of Legacy Applications: A Case Study of Prefetching using Dynamic Monitoring Mauricio Serrano, Jose Castanos, Hubertus Franke
Outline • Overview of the Dynamic Compilation Infrastructure • PFLOATRAN Application • Delinquent Load Optimization • Performance Results • Open Challenges
Acknowledgments • IBM Research: • Mauricio Serrano, Jose Castanos • IBM Toronto: • Allan Kielstra, Gita Koblents, Yaoqing Gao, Vijay Sundaresan, Kevin Stoodley, Derek Inglis, Patrick Gallop, Chris Donawa • Oak Ridge National Lab: • Stephen Poole
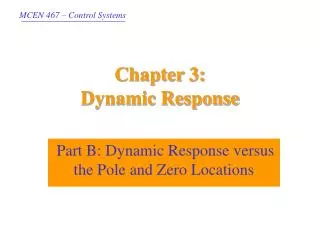
exec Fat binary Combined Static-Dynamic Optimization Infrastructure Profile Directed Feedback profiling information C, C++, F Front End High Level Optimizer (TPO) Code Gen (TOBEY) wcode wcode Traditional Execution exec OpenMP UPC CAF WCode Driver CPO Runtime wcode Code Gen (TR) Dynamic Compiler (TR) HW events
CPO Managed Runtime • Loads and launches user application • Receives as input enhanced executable files • Binary executable • Program representation (IR) used generate the binary and compiler metadata • Oversees execution of user codes • Maintains a Code Cache of binary instructions (from both static and dynamic compilation) • Also includes mappings of binary code, symbols and constants to the IR (and therefore to source code) • Monitoring environment • Permits identification of performance bottlenecks on hot sections of the code • Supports mapping of hardware events (i.e. cache misses) to binary code and then to internal data structures (i.e. IR) • Triggers dynamic compilation and optimization • Includes Testarossa (TR) Dynamic compiler as a library • CPO agent provides to the JIT: • Stored IR representation of the function • Relevant runtime information • Profile values, actual values, specific machine characteristics • JIT provides new binary sequence for the instruction and compilation metadata • JIT and managed runtime collaborate on linking the dynamically generated code into the running executable
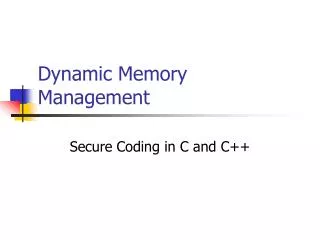
Architecture of PMU Online Collection Epoch # sample request for Epoch # PMU Server CPO Runtime AIX Trace batch of samples run application register PID of application Hardware sample event a.out Power5/6 SIAR-SDAR
PFLOTRAN • Multiphase-multicomponent reactive flow and transport • Geologic sequestration of CO2 on saline aquifers • Coupled system • Mass and energy flow code (PFLOW) • Reactive transport code (PTRAN) • Modular, object oriented F90 • HDF5 for parallel IO • PETSc 2.3.3 library (Argonne) • Parallel solvers and preconditioners • SNES nonlinear solvers for PFLOW • KSP linear solver for PTRAN • Most of the computation time is spent inside PETSc routines • Scalable • 12000 cores with 79% efficiency (strong scaling) • Domain decomposition
Loop prefetch analysis PetscErrorCode MatSolve_SeqBAIJ_3_NaturalOrdering(Mat A,Vec bb,Vec xx) { … /* forward solve the lower triangular */ for (i = 1; i < n; i++) { v = aa + 9*ai[i]; vi = aj + ai[i]; nz = diag[i] - ai[i]; idx += 3; s1 = b[idx]; s2 = b[1+idx]; s3 = b[2+idx]; while (nz--) { jdx = 3*(*vi++); x1 = x[jdx];x2 = x[1+jdx];x3 = x[2+jdx]; s1 -= v[0]*x1 + v[3]*x2 + v[6]*x3; s2 -= v[1]*x1 + v[4]*x2 + v[7]*x3; s3 -= v[2]*x1 + v[5]*x2 + v[8]*x3; v += 9; } … } /* backward solve the upper triangular */ for (i = n-1; i >= 0; i--) { … } } n is number of nodes in domain (div by num CPUs) distance between ai[i+1] and ai[i] is usually 7 (3D) nz is usually 3 (3D) cache misses when accessing array aa
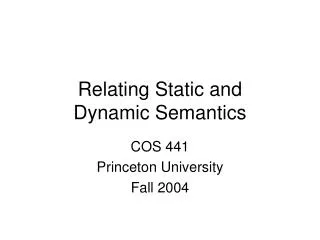
i-1 i i+1 i+2 504 bytes aa 216 bytes 288 bytes forward backward Memory Access Patterns • PETSc’s MatSolve_SeqBAIJ_3_NaturalOrdering() is selected to solve RICHARDS and MPH problems (3 DOF; from PFLOTRAN problem input file) • PFLOTRAN uses star-stencil with width = 1 • PETSc supports other stencil shapes and widths, and different solvers for different DOF • ai[i+1]-ai[i] = • 7 for internal nodes in 3D domain • 5 for surface nodes in 3D and for internal nodes 2D • ai[i] computed at initialization time • nz = diag[i] – a[i] = 3 for internal nodes in 3D domain (2 for 2D) • Access pattern in loop1 (forward solve) is sequential, with gaps, for each iteration • 3 (nz) * 9 (elements) * 8 (sizeof double) = 216 bytes are accessed sequentially • 4 (7-3) * 9 (elements) * 8 (sizeof double) = 288 bytes are skipped • Access pattern in loop2 (backward solve) is similar but order is reversed • Hardware prefetcher cannot detect stream, because there is a gap of more than 2 cache lines
Prefetching in forward solve loop PetscErrorCode MatSolve_SeqBAIJ_3_NaturalOrdering(Mat A,Vec bb,Vec xx) { … /* forward solve the lower triangular */ for (i = 1; i < n; i++) { v = aa + 9*ai[i]; vnext = (char *)(aa + 9*ai[i+4]); __dcbt(vnext); __dcbt(vnext+128); __dcbt(vnext+208); vi = aj + ai[i]; nz = diag[i] - ai[i]; idx += 3; s1 = b[idx]; s2 = b[1+idx]; s3 = b[2+idx]; while (nz--) { jdx = 3*(*vi++); x1 = x[jdx];x2 = x[1+jdx];x3 = x[2+jdx]; s1 -= v[0]*x1 + v[3]*x2 + v[6]*x3; s2 -= v[1]*x1 + v[4]*x2 + v[7]*x3; s3 -= v[2]*x1 + v[5]*x2 + v[8]*x3; v += 9; } … } }
Dynamic Optimization Through Software Prefetching Process Background monitoring to identify candidate methods Too many cache misses in a method Instrument method to collect additional information- Loop trip count- Cycles per iteration Analysis to determine location and parameters for software prefetching Prefetch? no: continue monitoring yes Insert prefetching instructions and recompile
Identify Candidate Methods • PMU Server collects data cache misses using sampling of hardware counters • Each sample contains (SIAR,SDAR): instruction address, data address • Sampling rate programmed by using RASO/PMCTL commands • We use L2 cache misses: MRK_DATA_FROM_L2MISS • PMU Server samples method hotness through timer interrupt • Concurrent with data cache misses sampling • Gives about ~ 100 samples/second • SDAR reported as 0, to distinguish from previous case • Select methods with significant percentage of data cache misses (PMU samples) and significant time contribution • At least 25% of PMU samples and 10 % of time samples • OVERHEAD AT THE SAMPLING RATES USED: without: 1108+/-1.0 with profiler: 1110+/-1.0, overhead: estimated at ~0.18 %
Determine if it is Worth Prefetching in a Candidate Method • Sampling of hardware counters gives a very rough estimate of candidate methods • If more precise evaluation is preferred, insert instrumentation for entry/exit and around calls to estimate its contribution to data cache misses • For POWER5: • CPI = PM_CYC / PM_INST_CMPL • CPIdcache = PM_CMPLU_STALL_DCACHE_MISS / PM_INST_CMPL • Method’s contribution to data cache misses = (CPIdcache/CPI)* (time samples for method/total time samples). • Recommend Prefetching steps if the following applies for a method: • CPIdcache > 0.4 AND • Estimate is > 6 %
Dynamically Profile the Method to Determine Loop Trip Values • Recompile the method using Testarossa’s profiling dynamic profiler infrastructure • Instrument a loop using the structure information for loop analysis in the TR Jit, if: • The loop has a primary induction variable (PIV) with arithmetic progression • PIV also reports the initial value and the increment value • Instrumentation: • Two instrumentations are inserted: • At exit block, instrumentation of the loop upper bound (LIMIT) for each iteration • Using DEF-USE chains, instrument the definition of the LIMIT outside of the loop • NOTE: currently the loops provided by TPO are all normalized (-O3 –qhot): • TPO transform all loops to the form: “for (int i=0; i < LIMIT; i++) {…} • We only profile “LIMIT” (loop upper bound)
Determine Cycles in a Loop Through Hardware Counters • Instrument loops containing delinquent loads where prefetching may be possible because: • The loop contain enough work for the total execution time of the loop, so that prefetching can cover ahead of time memory latency • Note: The loop may contain nested loops where delinquent loads are located • INPUTS to this phase: • Loop trip counts • Delinquent loads
Analysis Framework • Backward slicing • Program analysis chases backward all computation needed to compute the address of a delinquent load using def/uses chains • A slice corresponding to a delinquent load is stored in a SliceGraph • Group related delinquent slices into delinquent slice groups • Analysis is a combination of: • Arithmetic difference in the slices contained in the slice group • How delinquent load groups interact with a induction variable in a loop with a small trip count
Analysis: Identify Delinquent Loops • Loops containing a significant number of delinquent loads • Estimate the work in the delinquent loop by a combination of: • A: Compiler analysis gives a rough estimate of the number of operations performed in the loop • B: Software profiling gives an estimate of the loop trip count • A and B are combined to give an estimate of “work” in the loop. • If “work” (A * B) in the loop is not enough, then move up in the Loop structure, and find the next outer loop with enough “work” • Stop when outer loop with enough “work” is found • Prefetching model: • How many iterations ahead to prefetch using the induction variable. • Estimate the overhead of a prefetching slice compared to the benefit
Analysis (cont): Determine Software Prefetching Parameters • Hardware counters are used to measure loop iteration cost, using results of previous PMU instrumentation: • Number of cycles/iteration (CI) • Number of dcache cycles/iteration (DCI) • Number of productive cycles/iteration (PCI = CI – DCI) • Prefetching will try to eliminate DCI • Number of Loop iterations to prefetch ahead (assuming DCI is eliminated) • 2000 cycles / PCI • Prefetching will occur if: • Number of iterations ahead is much less than the total loop trip count • Cost of prefetching slice is much less than DCI. • Prefetching will insert several prefetches for the Slice Group, prefetching several delinquent loads at once.
Insert Software Prefeteching • Insert data cache touch instructions in Testarossa’s intermediate representation (TRIL) according to the previous analysis
Evaluation Infrastructure • Power5 • 1.66MHz, L2: 1.875MBytes, L3: 36MBytes/chip • Sampling period: 45 seconds • Allocation with large pages (16Mbytes) • Power6 • 4.7MHz, L2: 4MBytes/Core, L3: 32 Mbytes/chip • Sampling period: 25 seconds • Allocation with medium pages (65kbytes) • Power7 • 3.55MHz, L2: 256K, L3: 4MBytes/core • Sampling period: 15 seconds • Allocation with large pages (16MBytes) • DSCR set to 7 (prefetch deepest for the hardware stream), helps for the other hot method (MatMult_SeqBAIJ_3) where the hardware stream can prefetch effectively
Open Challenges • The PFLOTRAN app maps very well to delinquent load optimization through dynamic compilation • Interesting code resides in a general purpose library (PETSc) • Hardware prefetching cannot detect streams • Prefecthing depends on input • Cache access characteristics are stable once indentified • Delinquent load optimization is one example where hardware features guiding a compiler improve programmer productivity • Many open questions remain: • Security • CPO agent, JIT and user app reside in same address space • Debugging • Testarossa can compile static languages (C, C++, Fotran) but still has a Java flavor and lacks important optimizations (better register allocator, better notion of arrays, loop transformations, vectorization, …) • We can compile parallel languages like UPC and OpenMP but TPO replaced all parallel semantics with function calls • Hardware events APIs still designed for off-line analysis rather than online operations • Exchange of information between static and dynamic compilation phases (“FatFile”) • XCoff and ELF define containers (sections) but there is no standard of how to store and reuse compilation information