Download
1 / 41
410 likes | 490 Views
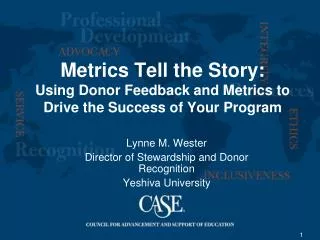
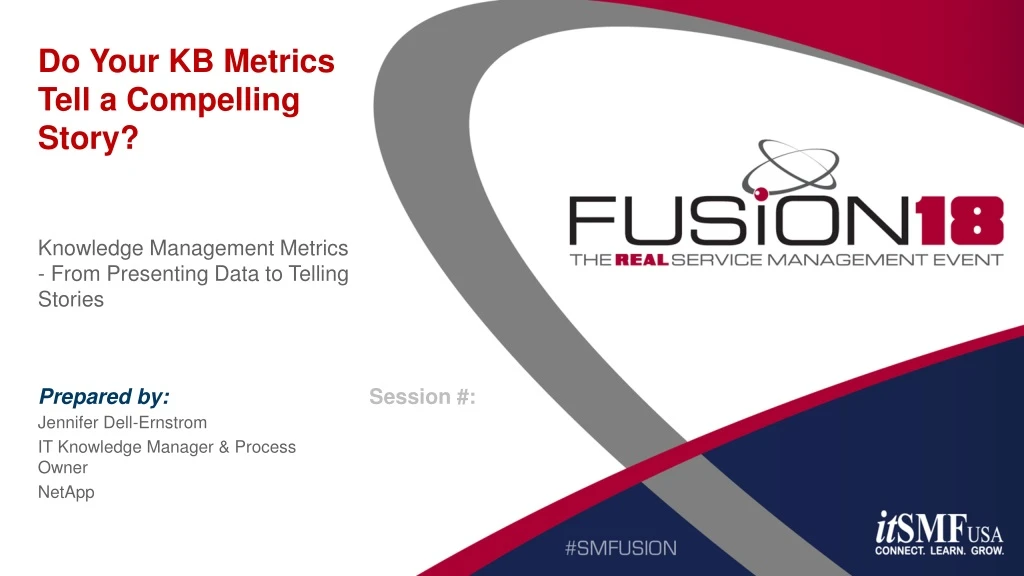
Do Your KB Metrics Tell a Compelling Story?. Knowledge Management Metrics - From Presenting Data to Telling Stories. Jennifer Dell-Ernstrom IT Knowledge Manager & Process Owner NetApp. Speaker Introduction. Name: Jennifer Dell-Ernstrom Title: IT Knowledge Base Manager Function: OCIO

E N D
Do Your KB Metrics Tell a Compelling Story? Knowledge Management Metrics - From Presenting Data to Telling Stories Jennifer Dell-Ernstrom IT Knowledge Manager & Process Owner NetApp
Speaker Introduction Name: Jennifer Dell-Ernstrom Title: IT Knowledge Base Manager Function: OCIO Company: NetApp Experience: 11 years experience in IT Service Operations; 8 specifically in Knowledge Management Expertise: Knowledge-Centered Service (KCS) Practices v6 Certified Fun Fact…
NetApp—The data authority in a hybrid cloud world FY’17 revenue: $5.5billion • Leader in 4 Gartner Magic Quadrants • #1 ONTAP, the worlds leading branded storage OS • #1 in Storage and Device Management Software • #1 in Commercial Storage for OpenStack • Fastest growing top 5 Total Enterprise Storage Systems vendor • Fastest growing top 5 Storage for Cloud IT vendor • Fastest growing top 5 All-Flash Array vendor • Fastest growing top 5 SAN vendor • Fastest growing Integrated Infrastructure and Certified Reference Systems
Agenda • Introduction to IT Knowledge Base at NetApp - Context • Metrics - Challenges • How storytelling can help • Examples – the Good, the Bad, the Ugly • Demo • Key Takeaways • Q&A
NetApp IT KM Intro Mission • Optimize support resources - incident deflection (shift-left) • Promote & enable self-service strategy • Integrated part of INC and PRB workflow to capture knowledge Methodology: Knowledge Centered Service (KCS) • CREATE VALUE Create content as a byproduct of solving problems • DEMAND DRIVEN Evolve content based on demand and usage • ABUNDANCE Share more, learn more • TRUST Reward learning, collaboration, sharing, and improving
Demand is dynamic Many presentation options available So much data to choose from New releases > new functionality Focus can depend on maturity level Lots of Challenges!
Metrics Framework Example • Baseline • Know your baseline measurement – where you started, perhaps at 0 • Actual • Measure ongoing • Example: 50% L1 Service Desk KB usage • Targets • Set targets • Example: 85% L1 Service Desk KB usage
What is a Story? • Adds meat to a skeleton • Engages at a human level, not just on a mathematical level. • Know your audience! • How do you know if you are engaging someone? • You are confronted with questions, doubts, musings • How do you know if you are successful? • Other people repeat your story! • Testimonials • Story must have a happy ending!
Executive Summary One Pager – THE UGLY Knowledge Management – PPT slides with Excel Charts
Incident Deflection Analysis – Monthly Data Windows 10 Microsoft Home Use Program Office 365 MFA Unique Viewers: 210 • Related opened tickets by these viewers: 25 • % Opened: 12% • % Deflected: 88% • % Tickets solved by L1: 48% Unique Viewers: 98 • Related opened tickets by these viewers: 0 • % Opened: 0% • % Deflected: 100% • % Tickets solved by L1: NA Unique Viewers: 373 • Related opened tickets by these viewers: 41 • % Opened: 11% • % Deflected: 89% • % Tickets solved by L1: 100% Unique Viewers: 319 • Related opened tickets by these viewers: 15 • % Opened: 5% • % Deflected: 95% • % Tickets solved by L1: 67% Includes NextGen MFA KB content
Incident Deflection Analysis – Cost Savings Windows 10 MFA Microsoft Home Use Program Office 365 For these 12 topics, deflected tickets result in annual savings of $700,000 Costs increase each time a ticket is escalated. Calculate savings for tickets shifted left from L2 to L1 and to Self-Service over a period of time. Unique Viewers: 210 • Related opened tickets by these viewers: 25 • % Opened: 12% • % Deflected: 88% • % Tickets solved by L1: 48% Unique Viewers: 98 • Related opened tickets by these viewers: 0 • % Opened: 0% • % Deflected: 100% • % Tickets solved by L1: NA Unique Viewers: 373 • Related opened tickets by these viewers: 41 • % Opened: 11% • % Deflected: 89% • % Tickets solved by L1: 100% Unique Viewers: 319 • Related opened tickets by these viewers: 15 • % Opened: 5% • % Deflected: 95% • % Tickets solved by L1: 67%
Why use dashboards? Balance workload • Dynamic KPIs • Drill-down feature • Transparency & Visibility • Extends limited KM resources • Dashboard addresses these challenges • Personnel changes • Lack of focus on knowledge • Teams not running reports • Uneven team performance • Workload within teams not clear Author focus Org changes Linkage to case quality Scattered reporting metrics
Use case possibilities are endless… • Knowledge Management • Feedback process • Ratings trends • Submissions process • Queue management • Content health L1 and L2 Knowledge content dashboards Service portal insights into KB usage Authordashboards
KM Content Health Submissions Summary Dashboard • Early Version… • Bar charts, lists • Trend data • Current status
KM Content Health Submissions Summary Dashboard • Later Version… • Rearranged data • Added variety • Personalized
KM Content HealthManagement Reporting - last fiscal month KPIs
KM Content HealthManagement Reporting - current fiscal month KPIs
KM Content Health Power BI – Content Data by Category Report
KM Content Health Power BI – FY19 Trends Report Tab – Mobile View
KM Content Health Power BI – Content Refresh Report Tab – Mobile View
KM Content Health Power BI – Dashboard View • Metrics Highlights • Total Unique Viewers increased to 6,209, with highest view count (1,209 viewers) for KB0005576 Microsoft MFA for Office 365; Initial Set-Up • 1,792 Total Articles were viewed, across 40 countries • Enhancement Highlights • ServiceNow enhancement released Aug 2 provides versioning and KB article subscription options in native app. • 407 people attended the 3 training sessions offered before the release. • High Level Benefits: • - Ability to revert earlier versions to current version with new workflow status Outdated • Authors can edit others content, with notification triggered to original author • Users can subscribe to their favorite knowledge articles & can get an email notification when a new version of an article is published. • Authors who have edited an article can get notifications when the article is checked out and republished as well as when comments are left.
Top Takeaways Dashboards save time and empower teams Experiment and build out based on feedback and interest Short, Visual, Large… Less is More
Challenges – The KPI Conundrum KB View Count • KB Article Views • Unique Viewers (participation rate) • Types of Viewers • Types of Articles Viewed KB Use Count • Tickets % with KB articles attached • Use Count % by Support Groups KB Search • Total searches • Unique user searches • # no search results found • Process related • # Created, Published, Updated, Retired • Time to publish • Article Quality Index (AQI) • Submissions related • Feedback and Ratings related • Support/Self Service • Self Service use rates • Ticket deflection to self service by topic areas • First Contact (L1) Resolution Rates • Time to resolve case • New employee ramp time • CSAT
Challenges – Too Many KPIs… Information Overload Back
Challenges - New Platform Releases New Opportunities to re-evaluate metrics De-customization: Removed 12 Fields, Simplified workflow, New fields New Enhancements: Added Versioning and Subscription options Back
KCS Performance Measures based on Process Maturity Level REFERENCE: “KCS Measurement Matters” http://library.serviceinnovation.org Back