Download
1 / 25
250 likes | 448 Views
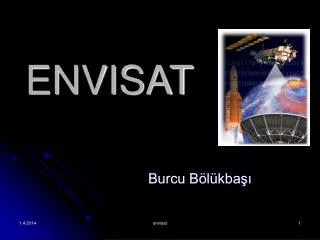
ENVISAT for Our Environment and Climate. Hartmut Grassl Max-Planck-Institute for Meteorology Hamburg, Germany. Tools for Understanding and Predicting Climate. In situ stations Sounding by balloons and operational satellites Ground-based remote sensing systems (radar, lidar)

E N D
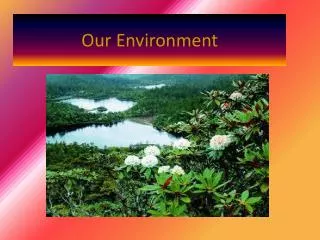
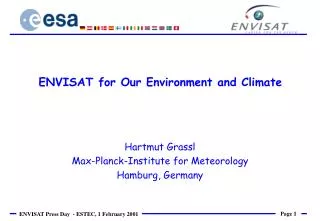
ENVISAT for Our Environment and Climate Hartmut Grassl Max-Planck-Institute for Meteorology Hamburg, Germany
Tools for Understanding and Predicting Climate • In situ stations • Sounding by balloons and operational satellites • Ground-based remote sensing systems (radar, lidar) • Global coupled models • Experimental or pre-operational satellitesENVISAT • Dedicated field experiments (including airborne remote sensing)
Plants - The Basis of our LifeorMonitoring the Carbon Cyclevia • vegetation index (NDVI) MERIS • biomass on continents MERIS • biomass in the ocean MERIS+AATSR+ASAR+RA • CO2 column content IASI on MetOp in 2006
The Biosphere viewed by SeaWiFS source: NASA GSFC
ENVISAT MERIS • clouds: • albedo • optical thickness • top height Aerosols Water vapour Phytoplankton Primary Produktion Suspended Matter Gelbstoff Vegetation / Land use source: GKSS Imaging Spectroscopy of Biosphere und Atmosphere using MERIS
Classification of Land vegetation of Northern GermanyMERIS simulation based on MOS data source: DLR-DFD
Phytoplankton Photo courtesy of Norman Nichols
0.014 centralNorth Sea Red TideNorth Sea 0.012 0.01 0.008 RLw [sr-1] 0.006 0.004 North Sea coastalwater 0.002 0 400 450 500 550 600 650 700 750 800 Wavelength [nm] Water leaving radiance reflectance spectra of North Sea Water with first 10 MERIS spectral bands source: GKSS
MOS 26.4.97 inverse modelling 12 50 10 100 8 150 6 200 250 4 300 2 350 0 50 100 150 200 250 300 350 µg/l chlorophyll source: GKSS
MOS 26.4.97 inverse modelling 50 45 50 40 100 35 Baltic Sea 150 30 Sylt KielBight 25 200 20 250 15 10 300 5 Helgoland Elbe-Estuary 350 0 50 100 150 200 250 300 350 mg/l Suspended matter source: GKSS
MOS 26.4.97 inverse modelling 1.2 50 1 100 0.8 150 0.6 200 250 0.4 300 0.2 350 0 50 100 150 200 250 300 350 a(440 nm) m-1 Gelbstoff source: GKSS
Red Tide in the German Bight source: GKSS
2 3 4 [mg/l] Lake Constance simulation of the suspended matter distribution for MERIS spatial resolution using Landsat Thematic Mapper data (21. 8.91) source: DLR-IMF
Coral reef monitoring using SeaWiFS Source: NASA-GSFC
sun MERIS AATSR METEO SAT SAR RA cloud sea surface topography cloud, PAR wind, waves, currents ICE SST phytoplankton, TSM, gelbstoff ENVISAT Operational Oceanography (ENVOC) source: GKSS
Meteosat PAR time series ~ 1-3 h interval MERIS conc. Pig., SPM, gelb 1-3 times per 5 days AATSR / AVHRR SST 1-3 times per 5 days ASAR / Altimeter wind - waves 1-3 times per 5 days PI parameter 2-3 months intervall 1 km, mean per 5 days Mixing / stratification model Primary production model Validation measurements ECOHAM 1 km, mean per 5 days Primary Production Data Assimilation Scheme source: GKSS
Aerosol Particles in the Troposphere • The least understood anthropogenic climate change agent • We get global maps of aerosol load and type over oceans and dark land surfaces from both MERIS and AATSR with clear separation of ocean colour from aerosol influence, even over coastal waters. • Also volcanic aerosol in the stratosphere can be monitored (over the ocean) by MIPAS, MERIS and AATSR.
Polar Stratospheric Clouds (PSCs) • key agents in depleting ozone, will be monitored by MIPAS as well as nitrogen compounds (the whole family) needed for an assessment of ozone depletion potential in the stratosphere • Uniqueness: PSCs + NOy from same sensor, day and night
ENVISAT for Operational Meteorology • MERIS: Day-time water vapour column content above continents or above clouds • MERIS: Day-time cloud top pressure (height) with higher accuracy than from conventional satellite sensors • AATSR: Ocean surface temperature with higher precision than from other sensors • All three data sets improve weather forecasting, also thanks to the near real-time evaluation and dissemination guaranteed by ENVISAT
Cloud Top Height derived from MOS data source: WeW
Water vapour distribution derived from MOS data source: WeW
My List of Wishes • successful launch • intense synergistic evaluation projects world-wide, including validation campaigns • continuation of successful sensors in Earth Watch missions (agreement between ESA and EU) • transfer to operational satellites (EUMETSAT), e.g. for altimetry, stratospheric profiling, ocean colour, in order to improve either seasonal climate anomaly predictions or to monitor compliance with UN conventions • European operational environmental satellite system as a key part of a global Earth observation system