Principles in map making
Principles in map making. How to make sound maps. Thinking Spatially Basics of Map making Map Elements Scale, Legend, Compass, Title and Source Visual considerations when Mapping Types of visualisation. Thinking Spatially. What’s going on around you?.

Principles in map making
E N D
Presentation Transcript
How to make sound maps Thinking Spatially Basics of Map making Map Elements Scale, Legend, Compass, Title and Source Visual considerations when Mapping Types of visualisation
Thinking Spatially What’s going on around you? “The most incomprehensible thing about the world is that it is comprehensible” - Albert Einstein Source: ICIMOD, 2000
People who are familiar with HIV/AIDS in Tanzania can visualize the situation. They knows where the problematic areas are, the issues at these localities, and the types of programs in these areas. We call this a mental map that has been generated from the information stored in the persons mind over the years, consciously or unconsciously. Source: ICIMOD, 2000
Maps are powerful tools These mental maps are not sufficient if we want to know about the problem in more detail or communicate it to others and make decisions. The Generals, planners, engineers and so on… all make use of maps and drawings to guide them. • Maps help us – • to visualize the situation • to make decisions • to implement the plans Source: ICIMOD, 2000
How does this relate to GIS GIS is a tool that can allow US to create maps of our data so WE can start THINKING SPATIALLY What is GIS Geographic Information Systems GIS can Capture, store, retrieve, analyse and display information based on their LOCATION
How do Maps Help do this? – Improve our Understanding of the world! A map is a picture of a place and gives you better understanding of that place. Map is a two-dimensional representation of a particular place. Maps are made for many reasons and therefore they vary in content and context. Different maps show different information. Different symbols are used to represent the features on earth onto a map, which are explained in the legend. The legend in a map tells what each symbol shows. So Well Made Maps can Quickly and Easily give Content and Context Source: ICIMOD, 2000
The usefulness of a map depends upon the following factors. Who is going to use them? The map audience or the users will influences how a map should look like. A map made for school children will be very different from one made for scientists. Similarly, tourist maps and topographic maps of the same area are very much different in their contents and look as they are made for different users. What is their purpose? The purpose of the map determines what features are included and how they are represented. The different purposes such as orientation and navigation, physical planning, management, and education lead to different categories of maps. Source: ICIMOD 2000
What is their content? The usefulness also depends upon the contents of a map. The contents can be seen as primary content (main theme), secondary content (base map information) and supportive content (legends, scale, etc). What is the scale of the map? The map scale is the ratio between a distance on a map and the corresponding distance in the terrain. Scale controls the amount of detail and extent of area that can be shown. Scale of the output map is based upon considerations such as - the purpose of the map, needs of the map user, map content, size of the area mapped, accuracy required etc. Source: ICIMOD 2000
Summary- Usefulness of the map How do the following influence the map? Who is using the Map? Who is making the Map? The Purpose The Content The Scale
Important Properties of Maps and GIS When using GIS or creating Maps there are Four factors that are Important Scale Legend Title Source All affect the Context of Data displayed and How the Data is and can be INTERPRETED
Scale of a Map What is scale? It is the ‘representative fraction’ it states the relationship between the distance on the map and the distance on the ground Why is Scale so IMPORTANT? The scale affects the level of detail a map/GIS dataset can show.
Map Scale Large-scale maps cover small areas, but can include a higher level of detail than small-scale maps which depict larger areas at lower detail. There are no precise definitions of large- or small-scale, but for most map users, the following general scale categories apply: • Large-scale: 1:250 to 1:1,000 • Medium-scale: 1:1,000 to 1:10,000 • Small-scale: 1:10,000 to 1:100,000 • Very Small-scale: 1: 100,000 to above Source: ICIMOD, 2000
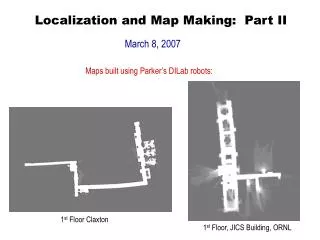
Large Scale 1:50,000 Small Scale 1:500,000
Scale Where is the scale information for GIS datasets GIS dataset do not state the scale on the map, because you can change the scale (zoom In and Out). The scale of GIS datasets can be found in the Metadata!!!! How does scale effect our use of GIS datasets The scale effects the use of GIS dataset in two ways How far we can zoom in and out reliably on a dataset Which GIS datasets we can integrate together
Scale What are the General rules with Scale issues Do not zoom below the scale as stated for the dataset (that is scale at which the data was collected) Only integrate GIS dataset that have been collected at the same or at a similar scale The maximum scale a dataset should be view is approximately 100 times the Scale that is stated in the Metadata. For Example: Data collected at 1:5000 it should not be viewed above 1:500000
Legend, Title and Source Legend Needs to Clearly define the category breakdowns Title Needs to define WHAT, WHERE and WHEN is been mapped! Source The source for both the Geographic data and Attribute Data
Title WHAT,WHERE and WHEN Source Both SPATIAL and ATTRIBUTE sources are stated Legend Clearly Defined Divisions
Issues to Remember Maps can LIE!! Maps are just one person’s representation of the Real World Like any source of information they can be misleading specially when used out of context How maps can be deceiving Inappropriate Legend Inappropriate Scale Source: ICIMOD, 2000
Population Density in Tanzania in 2002 by ward
Practical How to add • Title – What, Where and When • Legend – Clear and Precise • Scale Bar • Source – Concise • Compass
Basic Cartographic concepts Map Design Cartographic standards Generalization Graphic Variables Use of Color Classification of Data Methods of Mapping
Map Design Map making is both science and art. Maps influence people’s perception of space. This influence is partly because of convention and partly because of the graphics used. People understand the world differently, express this understanding differently in maps, and gain different understanding from the maps.
Cartographic standards Basic Map Elements Administrative boundaries Either Black or Grey Higher Administrative unit the thicker the line Roads Red Tracks dashed lines (light red/brown) Rivers and Lakes Blue Streams dashed lines light blue What do you think Health Centres should symbolized
Map Design Generalization Maps contain a certain level of detail depending upon its scale and purpose. The process of reducing the amount of detail in a map in a meaningful way is called generalization. Generalization is done normally when the map scale has to be reduced. However, the essence of the contents of original map should be maintained. This implies maintaining geometric and attribute accuracy as well as the presentation quality of the map. Source: ICIMOD 2000
Size Value Texture Colour Orientation Shape Map Design Graphic Variables The differences in the graphic character of symbols give different perceptions to the map reader. These graphic characteristics are termed as graphic variables which can be summarised as size, Lightness or grey value, Grain or texture, Colour, Orientation, and Shape or form. Source: ICIMOD 2000
Hue Saturation Intensity Use of Colour Colour perception has psychological, physiological and conventional aspects. It has been noted that it is difficult to perceive colour in small areas, and more contrast is perceived between some colours than between others. In addition to distinguishing nominal categories, colour differences are also used to show deviations or gradation. Source: ICIMOD 2000
Classification of Data The representation of data for mapping will depend on the measurement scale of the data. Nominal scale: The differences in data are only of qualitative nature, e.g., differences in facility type, land use or geology. Ordinal scale: Only the order of the attribute values is known, such as more than or less than, “small - medium – large” or “cool - tepid - hot”. Interval scale: Both the hierarchy and the exact distance is known, but it will not be possible to know the ratios, e.g., the temperature or the altitude values. Ratio scale: Data can be measured on a ratio measurement scale, e.g., the number of children in a family or income. Source: ICIMOD 2000
Mapping Methods • standardized ways of applying graphic variables for rendering information components • based on the measurement scale and nature of the distribution of objects Chromatic maps: Renders Categories of areas with different colours. This for nominal scale, Development Regions of Nepal Source: ICIMOD 2000
Access to safe drinking water Annual precipitation Mapping Methods Choropleth maps: Values are calculated for area and expressed as stepped surface, showing a series of values. The order between the classes can be seen. Isoline maps: Isoline maps represent continuous phenomena. Isolines connect the points with an equal value and show the trends. Source: ICIMOD 2000
Major Airports No. of Biogas Plants Mapping Methods Nominal point data: Nominal data represented by symbols that are different in shape, orientation or colour. Absolute proportional method: Discrete absolute values for point locations or areas are represented by proportional symbols. Source: ICIMOD 2000
Mapping Methods Diagram maps: Diagrams are used in the maps to allow comparisons between figures or to visualize temporal trends. Dot maps: Dot maps represent point data through symbols. Each dot denote the same quantity. Eg. One Dot = One thousand people. Population distribution, 1991 Source: ICIMOD 2000
Migration trend Population growth rate Mapping Methods Flowline maps: Simulate movement using arrow symbols. Arrows indicate route and direction of flows and volume is shown by the relative thickness of the arrow shaft. Statistical surfaces: Three dimensional representation of qualitative data such as used in choropleth and isoline maps. Source: ICIMOD 2000
New Map Output Types With the added potential of digital computers, new ways of visualization and using spatial information are being developed. New products like electronic atlases, cartographic animations and are coming up in the field of spatial information. These developments allow easy access through the GIS to text documents describing a parcel of land, photographs of the location, or a video clip of the landscape of the study area. Source: ICIMOD 2000
Demonstration of Map Making The process from Question to Map Determine what type of Map best answers the Question Set the Classification of the data Create Output Layout Set the Legend, Scale, Title and Source Output Map
Summary Using cartographic standards Use of graphic symbols Use of colour Use of different mapping methods