Download
1 / 24
240 likes | 446 Views
The 28 th Annual International Symposium on Forecasting June 22-25, 2008, Nice, France. FORECASTING METHODS OF NON-STATIONARY STOCHASTIC PROCESSES THAT USE EXTERNAL CRITERIA. Igor V. Kononenko, Anton N. Repin National Technical University “Kharkiv Polytechnic Institute”, Ukraine. INTRODUCTION.

E N D
The 28th Annual International Symposium on ForecastingJune 22-25, 2008, Nice, France FORECASTING METHODS OF NON-STATIONARY STOCHASTIC PROCESSES THAT USE EXTERNAL CRITERIA Igor V. Kononenko, Anton N. RepinNational Technical University“Kharkiv Polytechnic Institute”, Ukraine
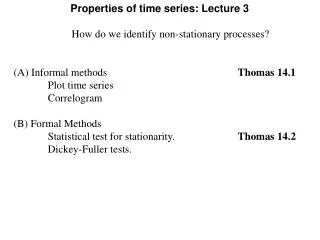
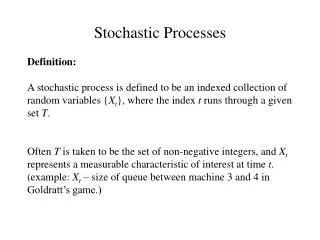
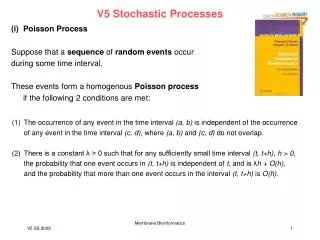
INTRODUCTION While forecasting the development of socio-economic systems there often arise the problems of forecasting the non-stationary stochastic processes having a scarce number of observations (5-30), while the repeated realizations of processes are impossible. To solve such problems there have been suggested a number of methods, in which unknown parameters of the model are estimated not at all points of time series, but at a certain subset of points, called a learning sequence. At the remaining points not included in the learning sequence and called the check sequence, the suitability of the model for describing the time series is determined.
PURPOSE OF WORK The purpose of this work is to create and study an effective forecasting method of non-stationary stochastic processes in the case when observations in the base period are scarce
H-CRITERION METHOD(I. Kononenko, 1982) Retrospective information q – number of significant variables including the predicted variable n – number of points in the time base of forecast Vector of values of the predicted variable
H-CRITERION METHOD (3) The parameters of all formed models are estimated using the learning submatrix – the vector of estimated parameters for j-th model – the vector of weighting coefficients considering the error variance or importance for building the model
H-CRITERION METHOD (4) For each j - th model at all points of past history we calculate Calculating
H-CRITERION METHOD (5) New learning and check submatrices are chosen. The number of rows in ГL is decreased by one. The process of estimation of model parameters and calculation of 3is repeated. The learning submatrix is used as the check one and the check submatrix - as the learning one, 4is calculated and similarly we continue using the bipartitioning. The process is stopped after a set number of iteration g. H-criterion:
METHOD, THAT USES THE BOOTSTRAP EVALUATION(I. Kononenko, 1990) Retrospective information q – number of significant variables including the predicted variable n – volume of past history Vector of values of the predicted variable
METHOD, THAT USES THE BOOTSTRAP EVALUATION (2) L – the number of a model in the set of test models Testing the model Ni – vector of independent variables B – vector of estimated parameters i – independent errors having the same and symmetrical density of distribution
METHOD, THAT USES THE BOOTSTRAP EVALUATION (3) 1. The parameters of the model we estimate using matrix basing on the condition – loss function, Determining the deviation from points of Numbers biasi form the BIASvector
METHOD, THAT USES THE BOOTSTRAP EVALUATION (4) 2. We divide the matrix into two submatrices – learning submatrix L and check submatrix C. First n-1 columns of matrix are included in submatrix L and n-th column is included in C. Estimating the parameters B of the test model and obtaining Calculating the deviation of the model from the statistics Let k=1, where k – number of iteration, which performs the bootstrap evaluation
METHOD, THAT USES THE BOOTSTRAP EVALUATION (5) 3. We perform bootstrap evaluation, which consists in the following. We randomly (with equal probability) select numbers from the BIAS vector and add them to the values of model. As a result we obtain “new” statisticswhich looks like the following We divide the matrix k (a new one this time) into L,k and C,k. We estimate the unknown parameters basing on L,k as earlier and calculate the model deviation from C,k
METHOD, THAT USES THE BOOTSTRAP EVALUATION (6) 4. If k<K-1 then we suppose that k:=k+1 and return to step 3 (where K – number of bootstrap iterations), otherwise proceed to step 5 5. Evaluating 6. If L<z then we suppose that L:=L+1 and move to step 1 (where z – number of models in the list), otherwise we stop. The model with minimal DL is considered to be the best one.
ANALYSIS OF METHODS Mathematical models Additive noise The loss function
ANALYSIS OF METHODS (2) Relative PMAD, evaluated at the estimation period PMAD, evaluated at the estimation period PMAD, evaluated at the forecasting period Relative MSE, evaluated at the forecasting period MSE, evaluated at the forecasting period
ANALYSIS OF METHODS (3) Average (across noise realizations):
ANALYSIS OF METHODS (4) We compared the characteristics with the two-sample t-test assuming the samples were drawn from the normally distributed populations:
ANALYSIS OF METHODS (5) PMAD, evaluated at the forecasting period
RESULTS OF ANALYSIS • When the number of partitions increases in case of using matricesR1 and R2 we observe the downward trend of PMAD with some fluctuations in this trend that depend on the ways of data partition • The partition according to the cross-validation procedure, in which the check points fall into the observation interval, produces significantly less accurate forecasts. The comparison of the efficiency of different partitions with randomly generated matrix R4 has shown that the reasonable choice of partition sequences permits to get a more accurate longer-term forecast
RESULTS OF ANALYSIS (2) The method that uses bootstrap evaluation produces the more accurate forecast than the cross-validation procedure The comparison of two suggested methods enables to state that the method that uses bootstrap evaluation makes it possible to obtain more accurate longer-term forecasts as compared with H-criterion method only in case of a small number of partitions. Otherwise the usage of selected matrices R1 or R2 permits to get more accurate forecasts. Nevertheless, the method that uses bootstrap evaluationturned out to be more accurate than the H-criterion method when using matrix R4
PRODUCTION VOLUME OF BREAD AND BAKERY IN KHARKIV REGION Mean relative errorfor 2003-2006 is 5,91 %
COMBINED USE OF TWO METHODS In the real-life problems the method that use the bootstrap evaluation might turn out to be more accurate in some cases. It is recommended to use the given methods together. In such case every result obtained by means of these methods must be assigned some weight on the basis of the a priori estimates of the methods accuracy. The final forecast will be received in the form of the weighted average value of individual forecasts.
Igor V. Kononenko – Professor, Doctor of Technical Sciences, Head of Strategic Management Department; Anton N. Repin – Post-graduate of Strategic Management Department STRATEGIC MANAGEMENT DEPARTMENT NATIONAL TECHNICAL UNIVERSITY “KHARKIV POLITECHNIC INSTITUTE” 21, Frunze St., Kharkiv, 61002, E-mail: kiv@kpi.kharkov.ua anton.repin@mail.ru Phone: +38(057)707-67-35 Fax: +38(057)707-67-35