Download
1 / 21
220 likes | 253 Views
Explore the projected changes in oceanic food webs and fisheries, focusing on the effects of climate change on tuna stocks. Learn about the complexities of food webs, differences among oceanic provinces, and the impacts on phytoplankton, zooplankton, and micronekton. Discover how climate change affects tuna habitat, temperature preferences, and oxygen sensitivity, influencing their distribution and abundance.

E N D
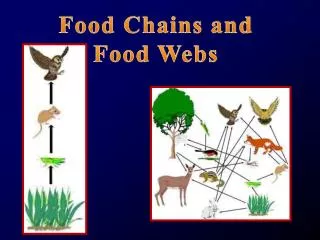
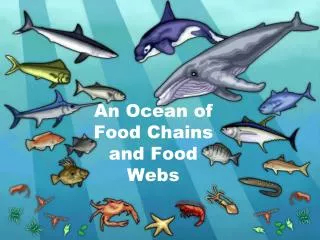
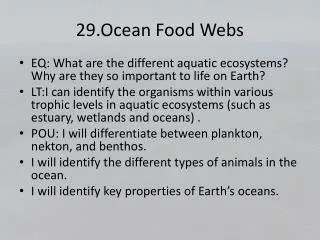
Outline • Food webs for tuna • Differences in food webs among provinces of the Pacific Ocean • Effects of CC on provinces and their food webs • Effects of climate change on tuna stocks
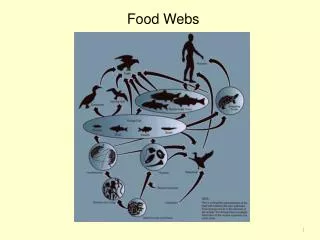
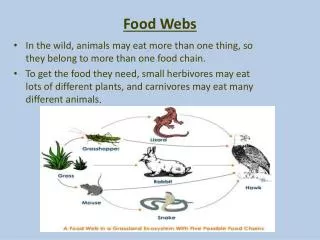
Tuna food web Food webs are complex
Five oceanic provinces • Warm pool Normal El Niño
Five oceanic provinces • North and South Gyres (case 3) and equatorial divergence (case 4)
Impact of climate change • Surface area of the provinces ↘ Rich equatorial divergence ↗ Poorer gyres and warm pool
Impact of climate change 2050 2100 present 2035 • Effect on phytoplankton and zooplankton Present
Impact of climate change • Effect on micronekton Shallow micronekton Deep micronekton Midwater micronekton Dee Image: Valerie Allain, SPC
Now, turning to tuna! Albacore
Tuna habitat – temperature • Each tuna species has evolved with a preferred range in temperature • Impacts vertical & horizontal distribution (habitat and food) & reproduction location and timing Range of sea surface temperature with substantial catches Source: Sund et al. (1981)
Tuna habitat – oxygen Sensitive to combined effects of SST + O2 Lesstolerant to low values Estimated lower lethal oxygen Skipjack Albacore Yellowfin Bigeye Most tolerant to low values
Tuna habitat – oxygen + 0 0 m 100 m Welloxygenated Albacore Bigeye Lowoxygen 500 m Skipjack Yellowfin Typical vertical O2 profile Change in subsurfacemay have more impact on lowoxygentolerantspecies
Skipjack projection Vanuatu = +2 Vanuatu = +3 Vanuatu = -12 Unexploited Fishing effort x 1.5
Bigeye projection 2000 2000 Adult biomass Larval density 2050 2050 Good fishing grounds could be displaced further eastward
Albacore projection 2000 2000 Adult biomass Larval density 2050 2050 No change in O2 Sensative to O2 so distribution changes WithmodelledO2
Conclusions • There is still uncertainty about impacts of climate change on tuna • Fishing has a strong impact and will continue to be a major driver of stocks
Resolution 2° Conclusions • Improved resolutions of SEAPODYM model are needed to update these preliminary results • Better projections can be achieved using an ensemble of models Resolution 1° Resolution 0.25 °